Why Trade Alone?

___________________________________________
MSTR   Potential breakout above this higher (down trending) line. Would ideally like to see with increased volume to confirm strength.

Alert signal sent at 293.93, June 20th

Alert to take some profit at 371.80,  July 3rd
Alert to take some profit at 332.80 July 13rd
Alert to take the rest of profit at 458.20 July 14th

MSTR Position Closed  +26.5% +47.2% +55.9%

Don’t miss our next big percentage winner

Start Now With A Free Trial  >>

____________________________________________

I’m not the expert on fundamentals but I do follow and associate myself with those that have that expertise.  And so I most often focus on trading stocks that have both strong technical analyses, along with good, strong fundamentals; to give me an extra advantage by having as much as possible in my favor.
____________________________________________

We help traders gain confidence.

Swing trader
This is my main focus on helping you to trade. Get my alerts live during market hours, often on stocks just coming up off support. And most often well before the breakout. Plus you’ll get live, continual updates during market hours on market direction and much more.
Day trader
My private chat room alerts you the very moment that I’m seeing evidence of a move (often well before the breakout) with specific pivots points to watch to help you to make the decisions you need to, quickly.
Investor:  Many traders also love my stock picks because they’re often better than average stocks, and so they hold them also in their longer term account.
Option trader: Trade the momentum alerts. An example from one of our members

Benefits of being a member

____________________________________________

What makes us different?

It doesn’t take all that much to put together a daily list of stocks in order to look good.  So called gurus know that one or two of these will run higher and then post about the (so called) few wins, just to look good!   These are tactics all too often used to exaggerate real results.

Instead what I give is a clear, concise plan with alerts sent out only when I see what I believe to be an exceptional stock setting up to move higher, based on the technical analysis. My technical  alerts are sent to you the moment I anticipate a move (most often well before the breakout

Over 75 thousand followers now on social media.

START  7 DAY FREE TRIAL »

_____________________________________________

Information provided for educational purposes only

The NEW Bull Market
Many stocks that where popular in the previous bull market are not necessarily performing now as they once where. My job is to continually narrow my focus to find you the NEW winning stocks that are far likely to outperform others, and to get that information to you before the next breakout.

See my real time alerts below with annotated charts
_________________________________________________

Part Time Traders  
Free 7 Day Trial  Then Only 99.00 a month  Reg. 159.00 a month. Limited Time Offer

SPY QQQ DIA IWM  Important Indexes  Updated September 8th, 2023
This link will open in a separate tab.

_________________________________________________________

Click on charts below to enlarge for more clarity.
Then go back on your browser to return to this page.
_________________________________________________________

ARM  IPO High risk trade (5 min chart below)

Alert sent at 56.97 on Sept 14th
Alert to take profit at 64.35,  Sept 8th

ARM Position Closed +12.9%

_________________________________________________________


AFRM  A bullish response tonight’s after releasing their earnings report, coming up off good support.

Alert sent at 14.20 on August 24th (AH)
Alert to take profit at 17.40,  August 25th

AFRM Position Closed +22.5%

_________________________________________________________

SPOT  Reversal attempt near potential support. Using a smaller position to start with to give this more wiggle room (to help reduce downside risk. Ideally would like to see this back above the 10 day moving average (fairly soon) to better confirm.

Alert sent at 134.32 on August 23rd
Alert to take profit at 160.20,  Sept 6th
Alert to take profit at 157.70,  Sept 8th

SPOT Position Closed +19.3% +17.4%

_________________________________________________________

TSLA  Subtle setup  This Doji Candlestick near potential support is indicating to me a possible reversal but needs confirmation.  Higher risk entry without confirmation so suggesting -1% max downside risk (by use of putting in a stop loss) at 212.77

Alert sent at 214.92 on August 18th
Alert to take profit at 248.80,  Sept 22nd

TSLA Position Closed +15.8%

_________________________________________________________

ELF  Selling maybe overdone. Potential drop to pop (red to green) setup. Looking for a close back above the 50 day average to confirm.

Alert sent at 116.82 on August 18th
Alert to take profit at 138.12,  August 31st

ELF Position Closed +18.2%

_________________________________________________________

SHOP  Selling seems extreme and near potential support. Higher risk entry so starting with a small starter position to give this more wiggle room, as it still needs to prove itself. Want to see this be able to get back above the 10 day moving average (near term) to better confirm.

Alert sent at 53.92 on August 17th
Alert to take profit at 64.80,  Sept 7th
Alert to take profit at 63.80,  Sept 8th

SHOP Position Closed  20.1% +18.3%


_________________________________________________________

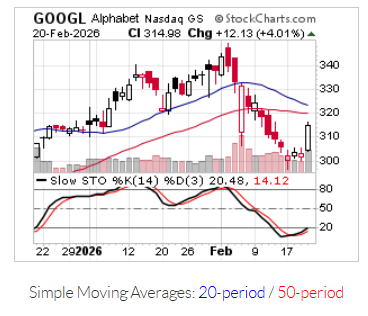
GOOGL  Strong response after earnings. I’m thinking could be good as a longer term swing; to potentially up to 150.00 (plus)

Alert sent at 123.50 on July 25th (AH)

GOOGL Position Open

_________________________________________________________

ANET  Strong, bullish response after good earnings.

Alert sent at 167.25 on July 31st (AH)

ANET Position Open

_________________________________________________________

SYM  Strong response after earnings I’m thinking 50.00 (plus) magnet short term and perhaps higher.

Alert sent at 43.50 on July 31st (premarket)
Alert to take profit at 59.60,  July 31st

SYM Position Closed +37%

_________________________________________________________

SPWR  Breakout attempt

Alert sent at 11.08 on July 20th
Alert to take (some) profit at 9.20 July 27th
FWIW Surprise news on upcoming earnings.

SPWR Position Closed  -17%

_________________________________________________________

CVNA  This bullish gap up coming up off support has my attention. Tight stop. Need to see follow through.
NEWS After the close, surprise news that earnings was moved ahead to tomorrow (before the market open)  My gut (and overall price action) told me this was likely a positive and not a negative despite the sell off after hours and so held the position overnight.

Alert sent at 37.37 on July 18th
Alert to take profit at 50.28,  August 31st

CVNA Position Closed +36%

_________________________________________________________

UPST  Breaking out above the $50.00 mark on increased volume. Continuation higher (likely)

Alert sent at 50.47 on July 17th
Alert to take profit at 64.80 July 25th

UPST Position Closed +28%

_________________________________________________________

CVNA  Red to green move, off support on increased volume.

Alert sent at 25.12 on June 7th
Alert to take profit at 41.70 July 12th

CVNA Position Closed +66%

_________________________________________________________

RIVN  Increased volume today is attention getting. Could breakout above 15.76

Alert sent at 15.62 on June 29th
Alert to take (some) profit at 25.05 July 10th

RIVN Position Closed +60%

_________________________________________________________

SMCI  Sell off seems extreme and just above good support  Ideally would like to see a close back above this pivot point at 219.18 to better confirm the likelihood of a reversal.

Alert sent at 218.27 on June 26th
Alert to take (some) profit at 301.20 July 19th
Alert to take (some) profit at 330.70 July 27th

SMCI Position Closed +38% +51.5%

_________________________________________________________

OSTK  Bullish gap up. Breaking out (with volume) above the 200 day moving average.

Alert sent at 22.44 on June 22nd
Alert to take profit at 31.70 July 3rd
Alert to take profit at 29.80 July 6th

OSTK Position Closed +41.3%  +32.8%

_________________________________________________________

MSTR   Potential breakout above this higher (down trending) line. Would ideally like to see with increased volume to confirm strength.

Alert sent at 293.93 on June 20th
Alert to take profit at 371.80 July 3rd
Alert to take profit at 332.80 July 13rd
Alert to take profit at 458.20 July 14th

MSTR Position Closed  +26.5% +47.2% +55.9%

_________________________________________________________

FDX  Earnings (AH) Potential drop to pop setup.  Want to see back above 220.00 (min) to better confirm the likelihood to go higher.

Alert sent at 216.20 on June 20th (AH)
Alert to take (some) profit at 267.60 July 27th
Alert to take (some) profit at 267.08 August 17th

FDX Position Closed +23.8%  +21.1%

_________________________________________________________

ABNB  Drop to pop setup on increased volume coming off support. 200 day moving average (just above) now key.

Alert sent at 106.56 on May 31st
Alert to take profit at 144.80 July 24th

ABNB Position Closed +35.9%

_________________________________________________________

UPST  Strong breakout stock. Seeing as attractive on this pullback, near potential support.

Alert sent at 23.22 on May 19th
Alert to take (some) profit at 45.80 July 14th

UPST Position Closed +97.2%

_________________________________________________________

UPST  Broke out on heavy volume on May 10th, after their earnings report was released.

Seeing as attractive on this lighter volume pullback today. Initially I want to see this close back above this key pivot point above at 16.33

Alert sent at 16.12 on May 12th
Alert to take profit at 22.80 May 18th

UPST Position closed +41.4%

_________________________________________________________

AI  A strong response after earnings this morning. The 2nd attempt premarket, pushing back above the $20.00 mark was attention getting.

Update Added to my position (and alerted to subscribers once again) after the market open at 20.44, the moment it showed strength with heavy volume. Want to see consistent buy interest well above 20.00 now to better confirm strength and the likelihood to continue higher.

Alert sent at 20.08 on May 15th (AH)
Alert to take (some) profit at 27.60 May 18th
Alert to take (some) profit at 44.20 May 30th

AI Position Closed +37.5% +120%

_________________________________________________________

PLTR  (AH) Strong action after earnings (with heavy volume)

Alert sent at 7.87 on May 8th
Alert to take profit at 15.77 Jun 9th

PLTR Position Closed +100%

_________________________________________________________

CFLT  (AH) Strong action after earnings (with heavy volume)

Alert sent at 21.00 on May 3rd (AH)
Alert to take profit at 34.04 June 2nd

CFLT Position Closed +62%

_________________________________________________________


SMCI  Strong response after earnings. Ideally want to see continuation above $110.00 to better confirm the likelihood to go higher.

Alerted at 108.50 on May 2nd (AH)
Alert to take profit at 146.75 April 16th
Alert to take profit at 165.00 April 19th

SMCI Position Closed  +35% +52.5%

_________________________________________________________

TSLA  Seems to be consolidating above the 5 day moving average, and now seeing as attractive on this pullback. Tight, hard stop at 157.31

Alerted at 159.52 on May 1st
Alert to take profit at 258.80 June 8th

TSLA Position Closed +62.2%

_________________________________________________________

MSTR  This Long Legged Doji Candlestick followed by this red to green move; pushing back above the 200 day moving average is compelling.

Alerted at 228.26 on March 16th
Alert to take some profit at 279.40 March 29th
Alert to take some profit at 335.20 April 11th
Alert to take some profit at 328.80 April 12th

MSTR Position Closed +22.4% +47.8% +44%

_________________________________________________________

AI  Seeing at good (potential support) Hollow red candlestick could be a good intial indicator for a reversal setup here.

Alerted at 20.80 on March 15th
Alert to take profit at 33.61 April 3rd
Alert to take profit at 32.95 April 4th

AI Position Closed +61.6% +58.4%

_________________________________________________________

QQQ Jan 20th, 2023 Weekly chart is attention getting, with a higher high, higher low and closing back above the 200 day moving average on increased volume.

QQQ Update May 5th, 2023  Weekly chart. Here’s where we are now. I’m thinking continuation higher is likely.
Click here for the newest chart setup

_________________________________________________________

Start receiving my exclusive stock alerts, along with my expectations on the market every trading day.

Try it for Free »

_________________________________________________________