XBI June 23rd, 2020
Weekly chart is compelling Expecting higher
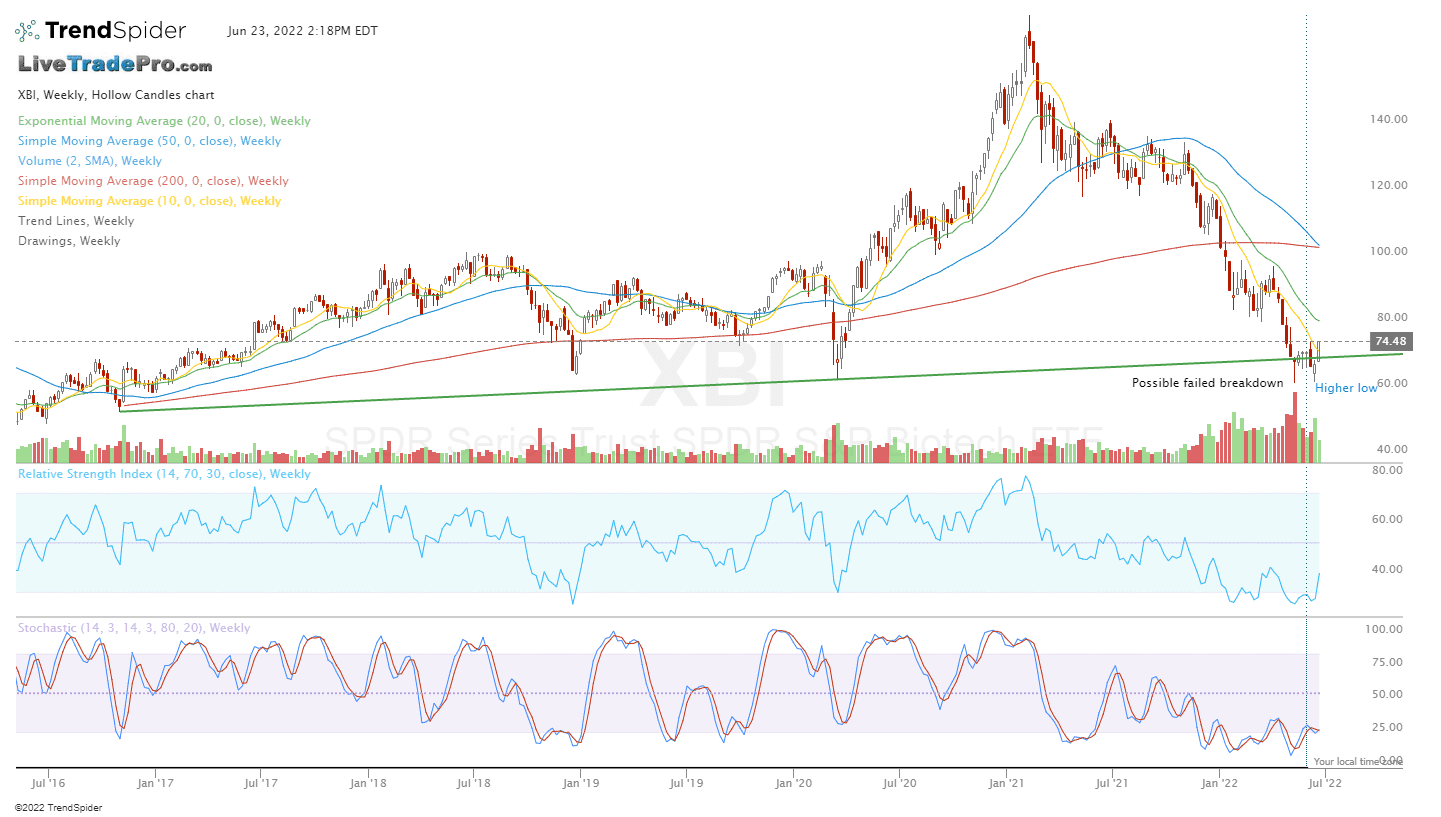
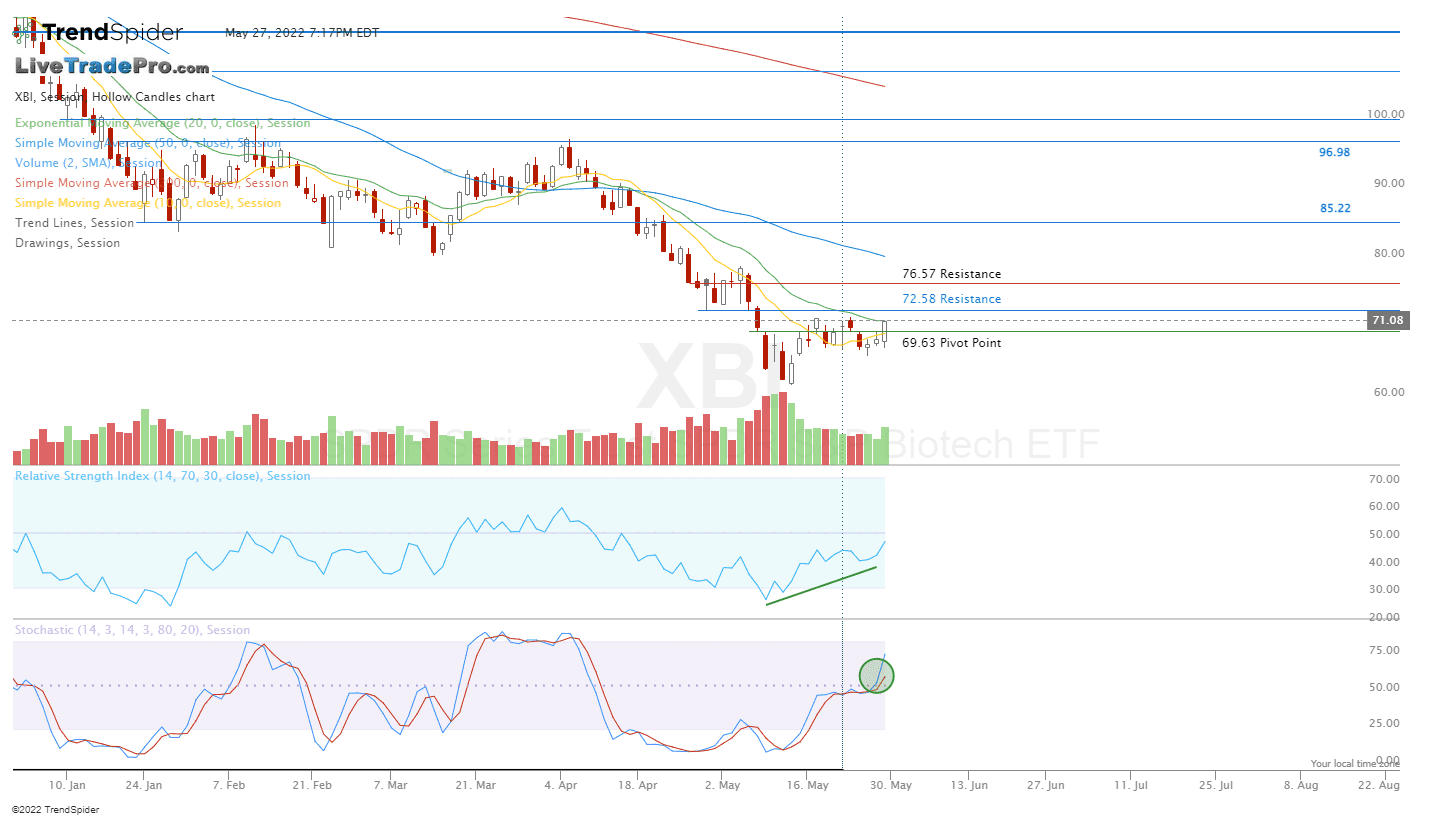
XBI May 27th, 2022
It’s been quite some time since biotech has sent a good signal to consider buying (and holding) Though this signal is somewhat subtle, this move after forming a new base, in consideration with the overall market; closing back above the 10 day moving average on increased volume is attention getting. Expecting higher.
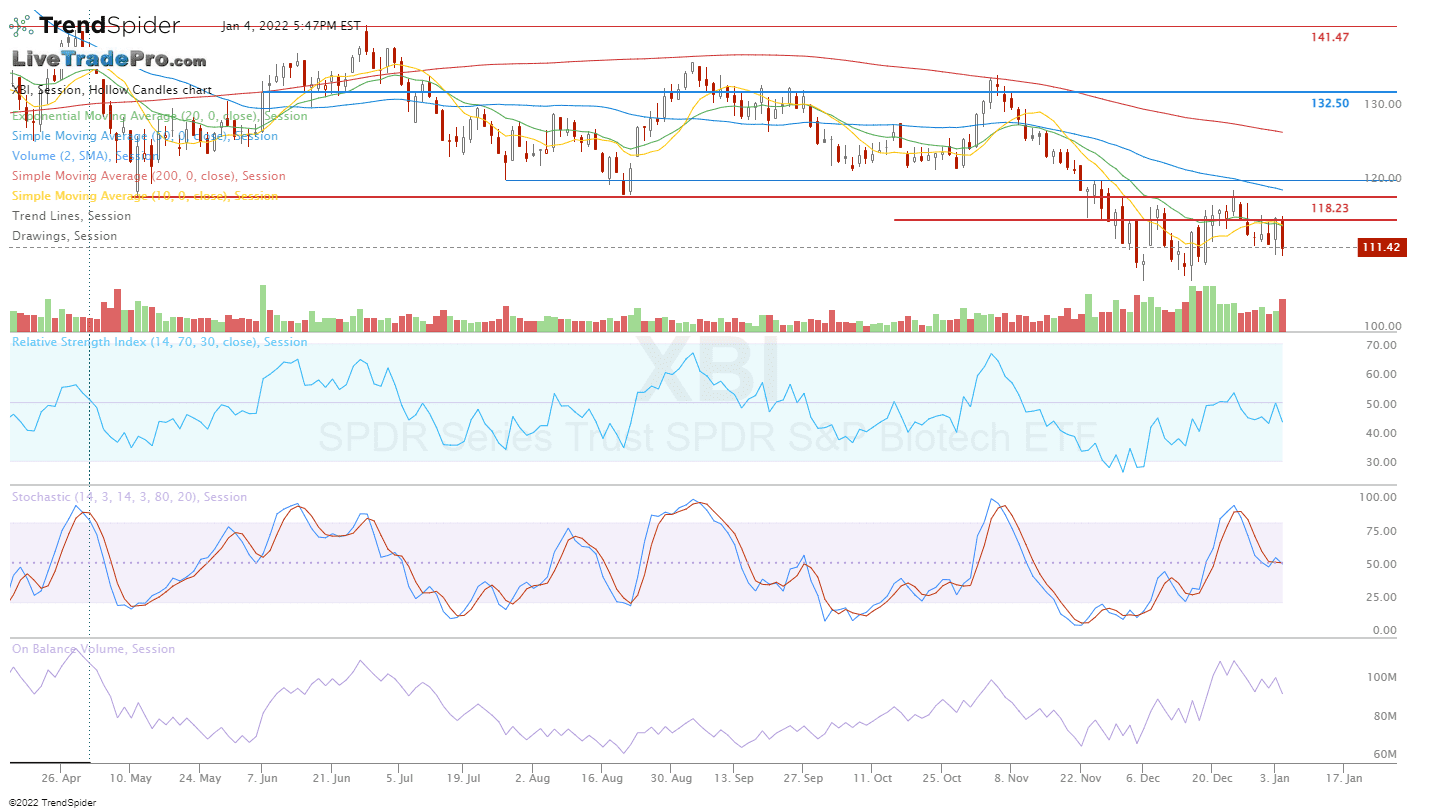
XBI Jan 4th, 2022
Down trend. Sideways at best.
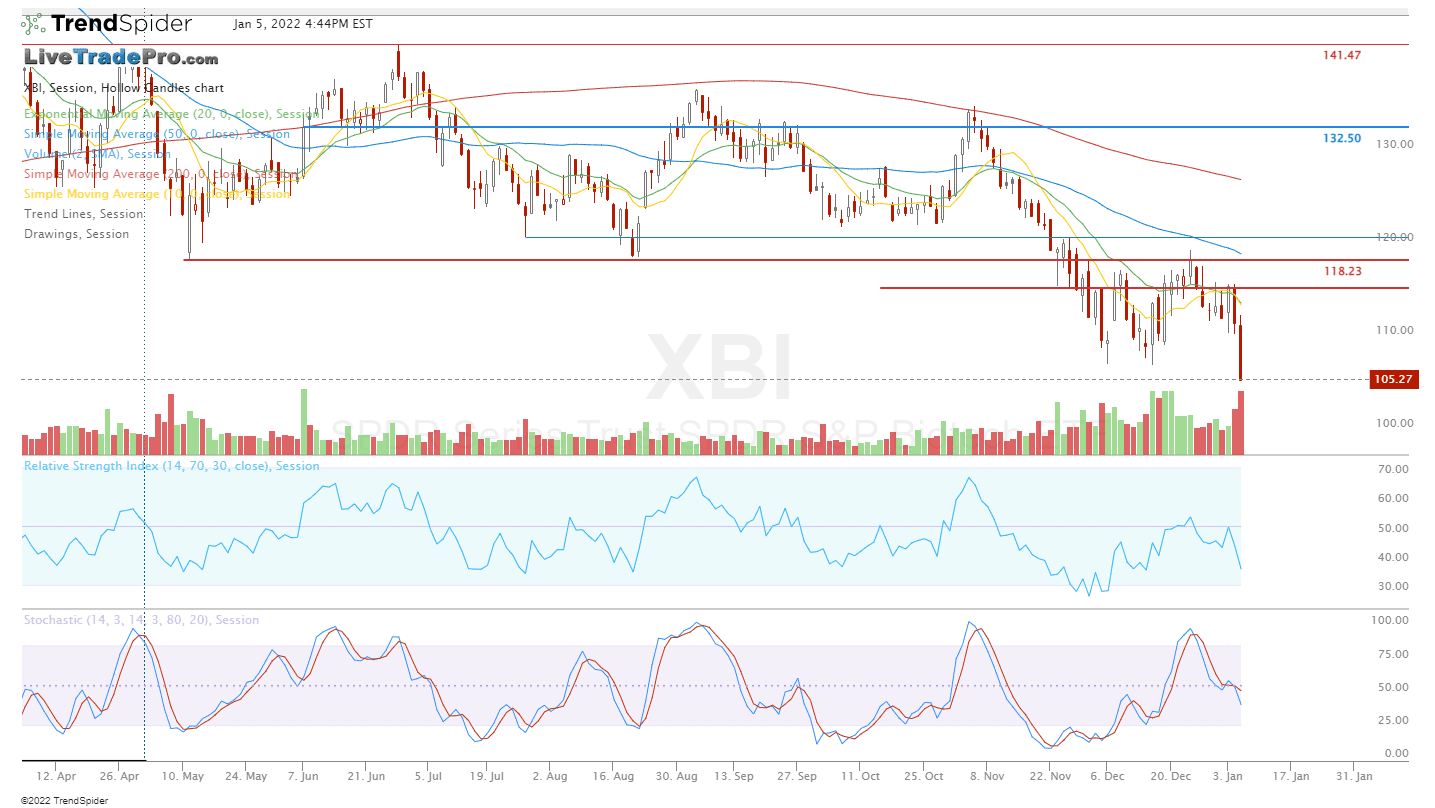
Jan 5th, 2022 Update
Bearish confirmed This likely continues lower
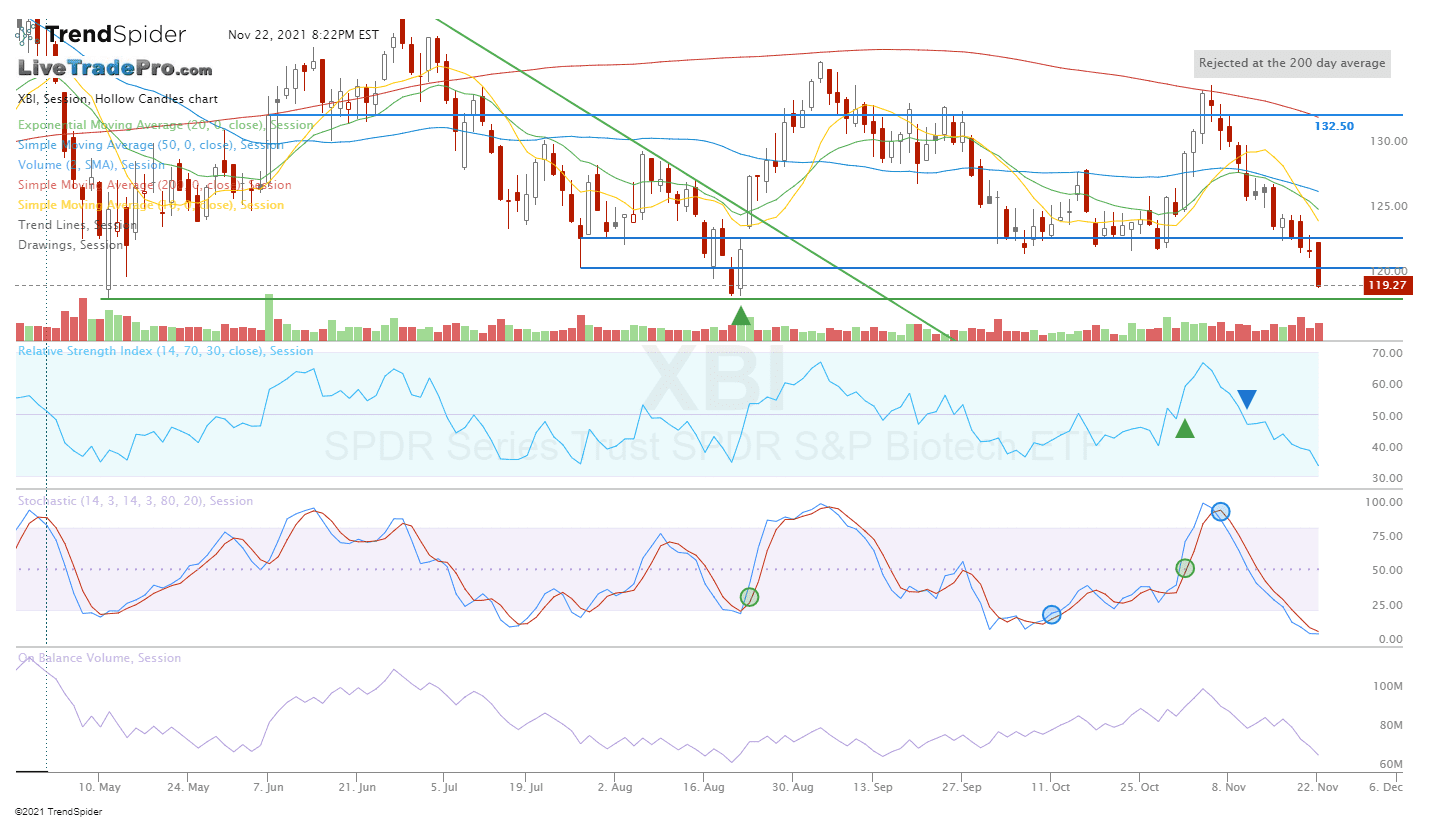
XBI Nov 22nd, 2021
We’ve been avoiding this (no alerts) since Nov 10th, after failing to hold the 50 day moving average.
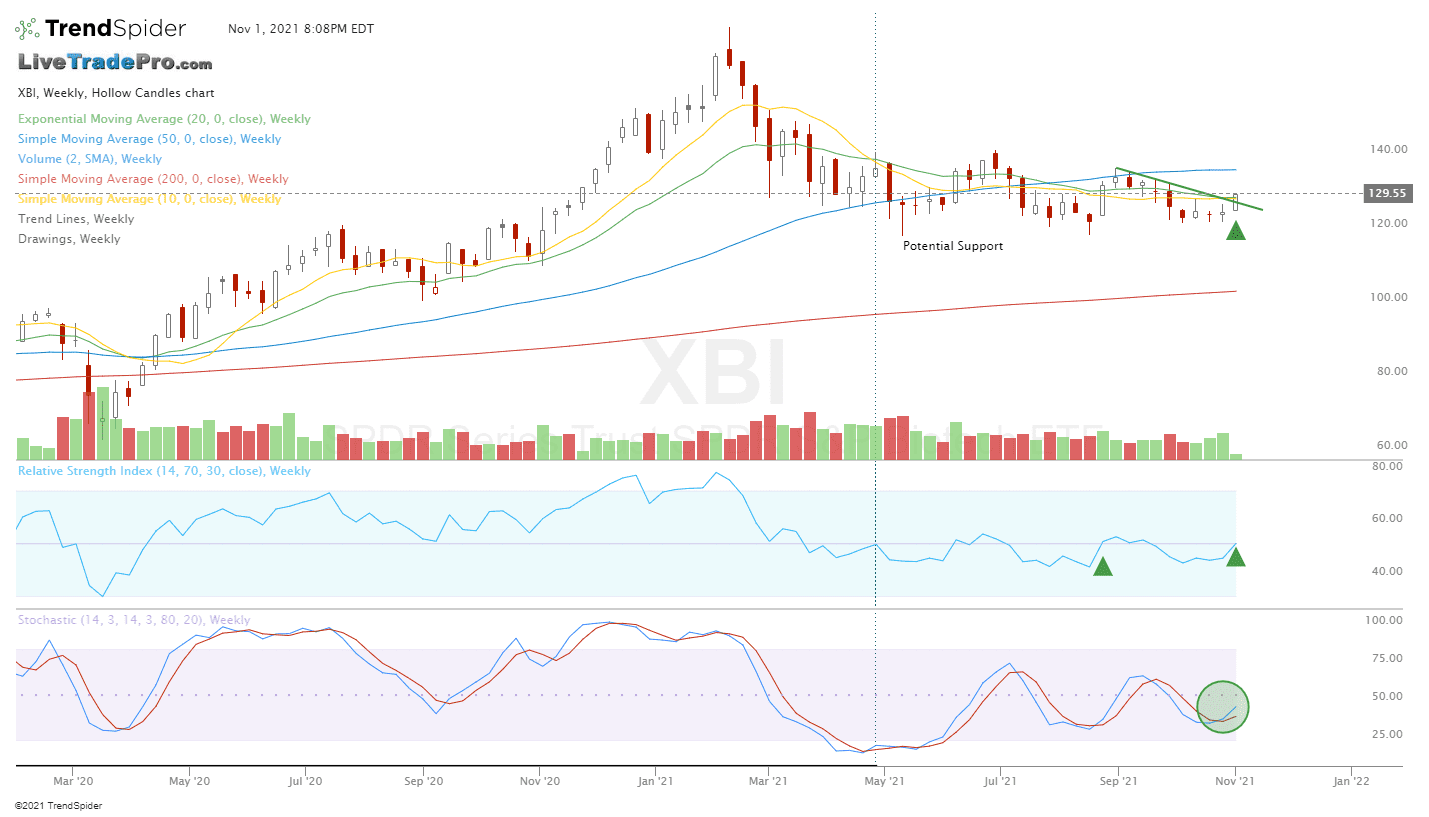
XBI Nov 1st, 2021
Weekly chart Starting to show some promise
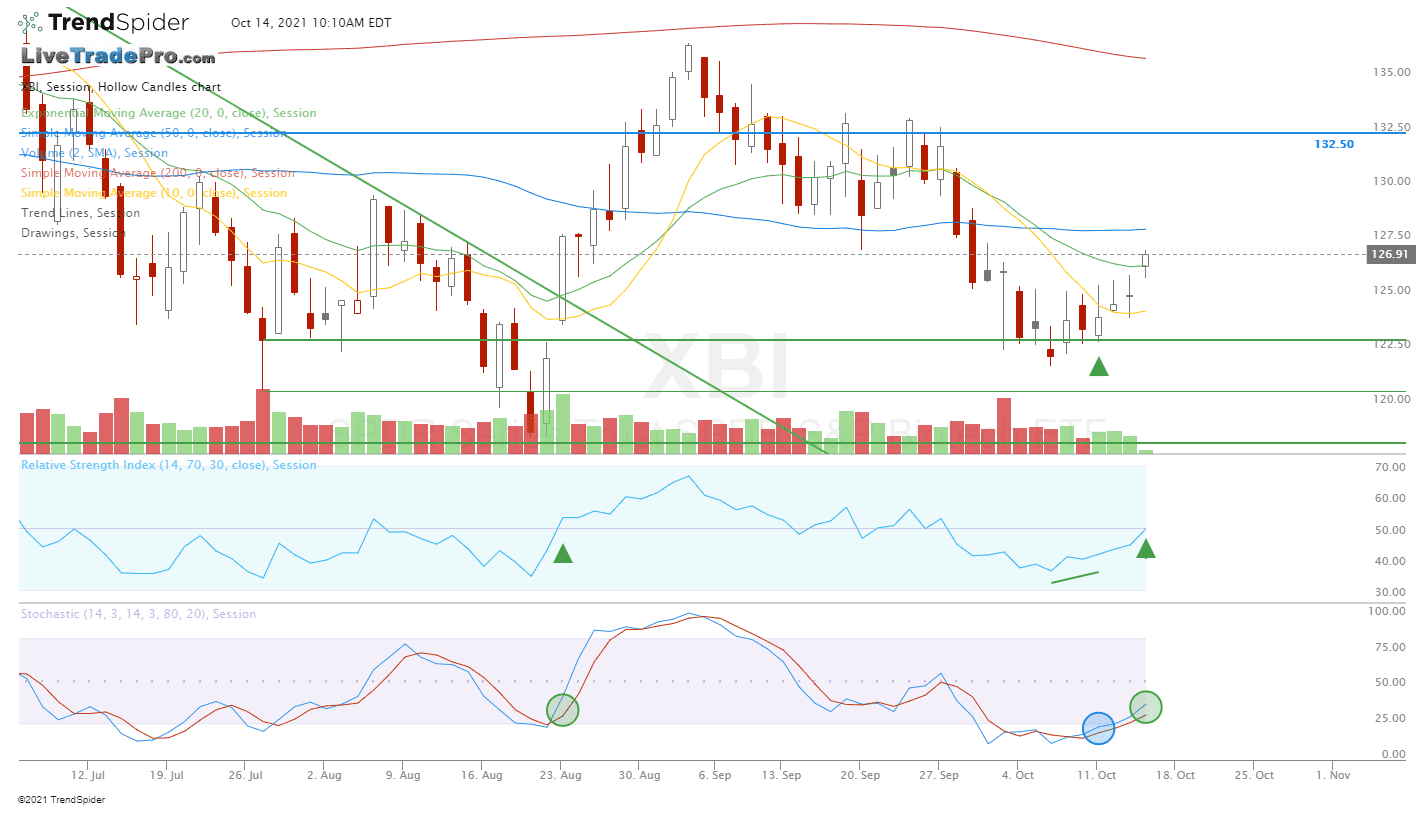
XBI Oct 14th, 2021
Signal confirming, pushing back above the 20 day moving average. I’m thinking continuation higher likely.
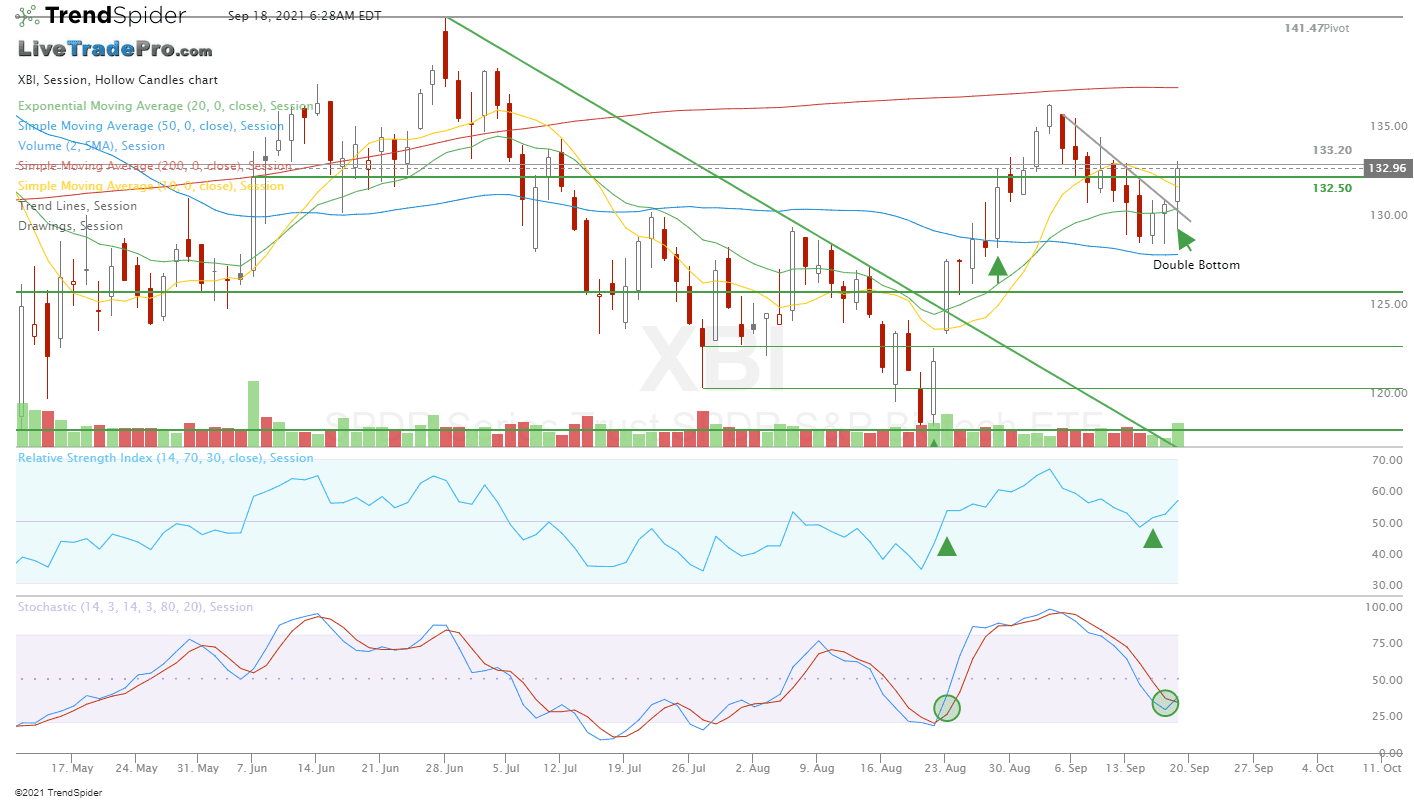
XBI Sept 16th, 2021
This double bottom and higher close today (on lower volume) telling me that sell pressure is lessoning. All about follow through now. RSI is strong. It also closed above the 20 day moving average
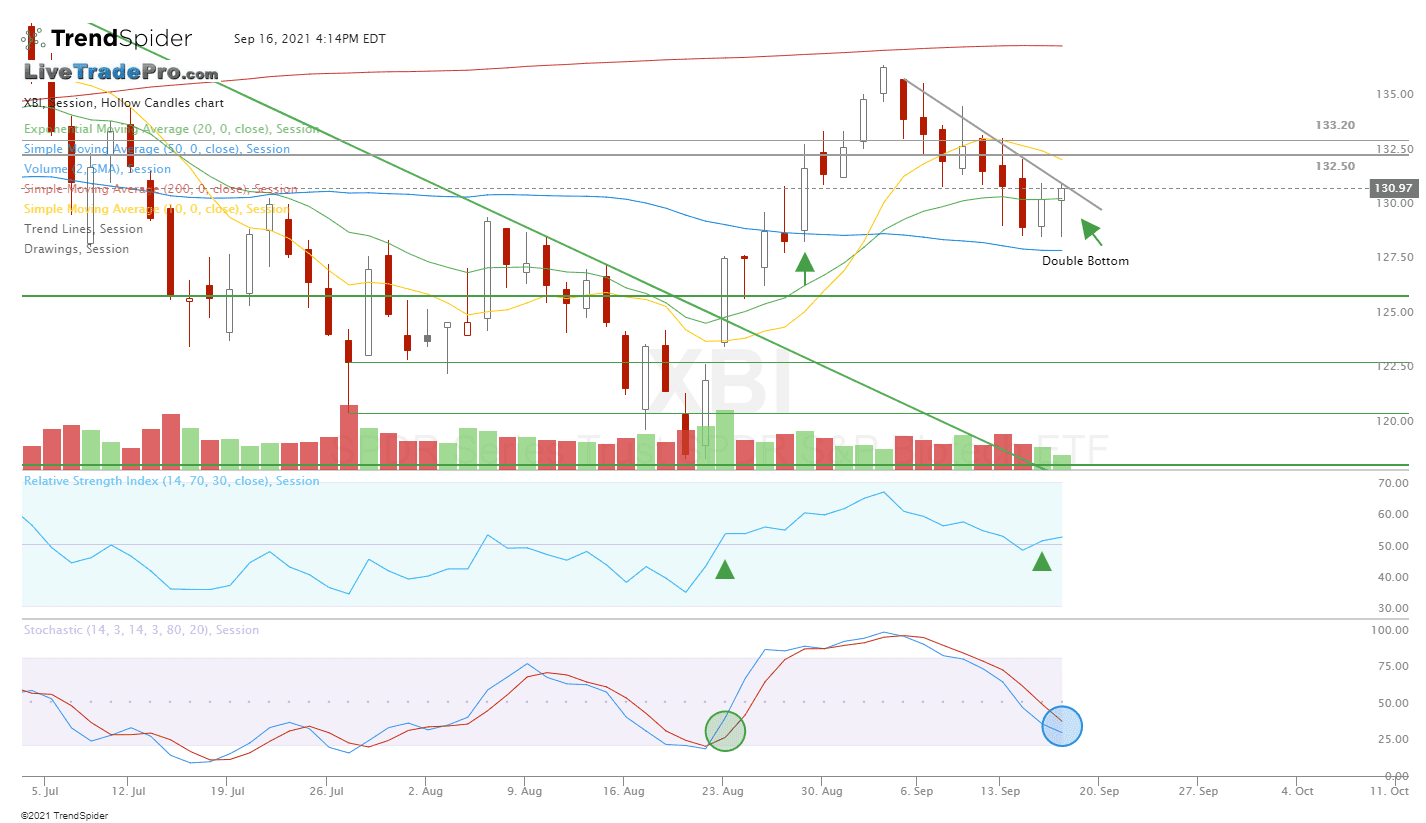
XBI 09-17-21 Bullish signal confirmed nicely; closing above resistance (on increased volume) and could continue higher.
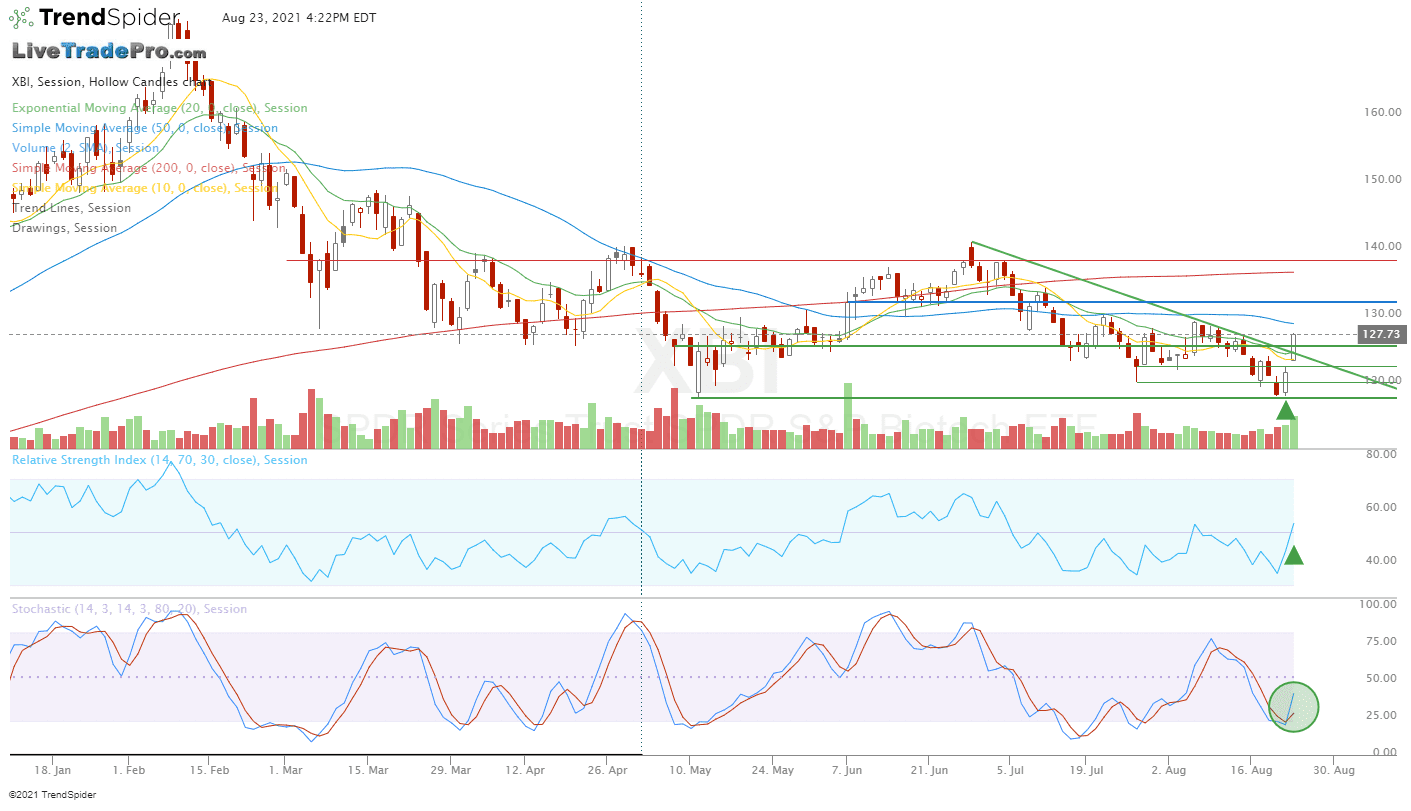
XBI August 23rd, 2021
A solid move for biotech sector today; breaking through resistance. Note increased volume. Next pivot point, the 50 day moving average at 129.29.
XBI August 20th, 2020
Weekly chart showing that selling is perhaps overdone. Now near support. Potential for a bounce.
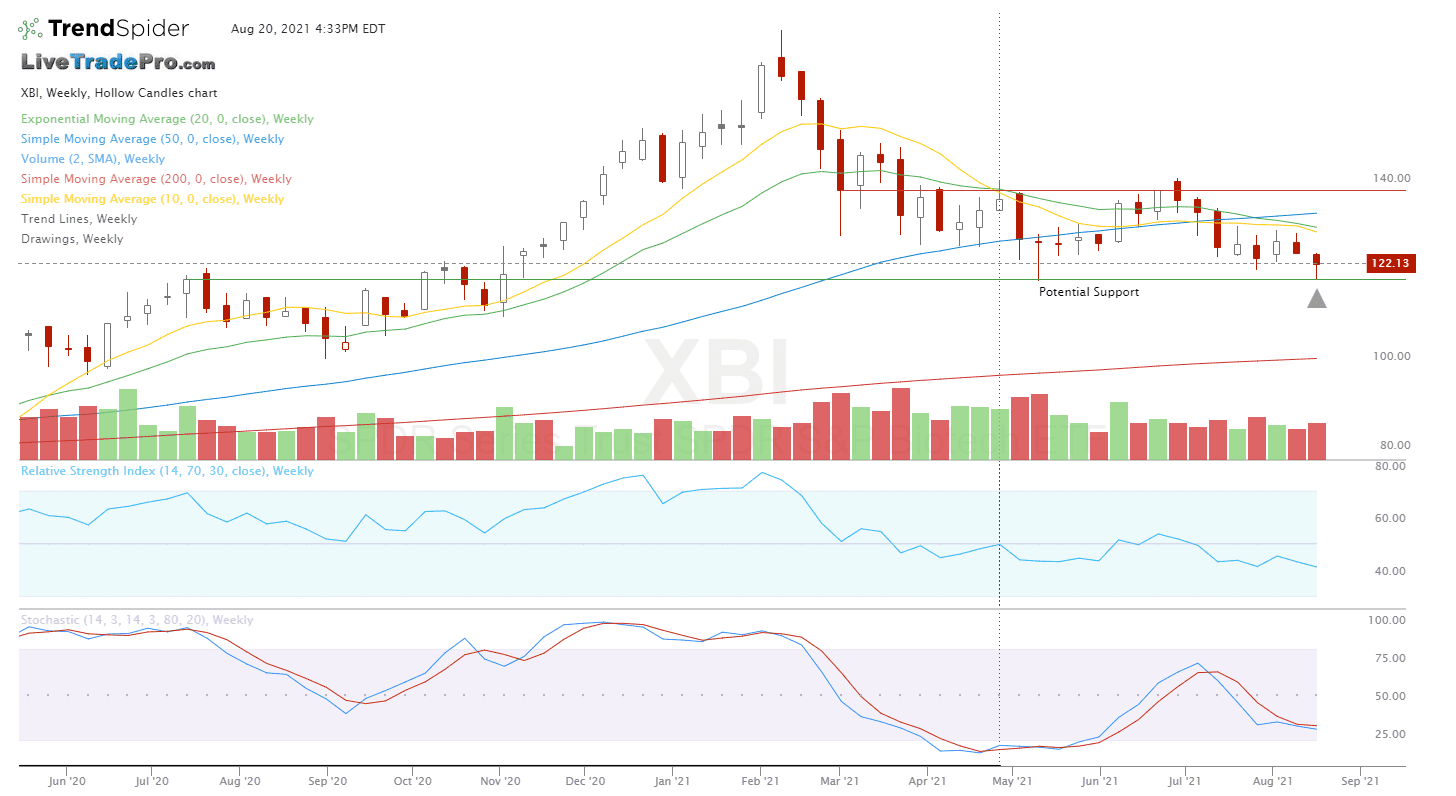
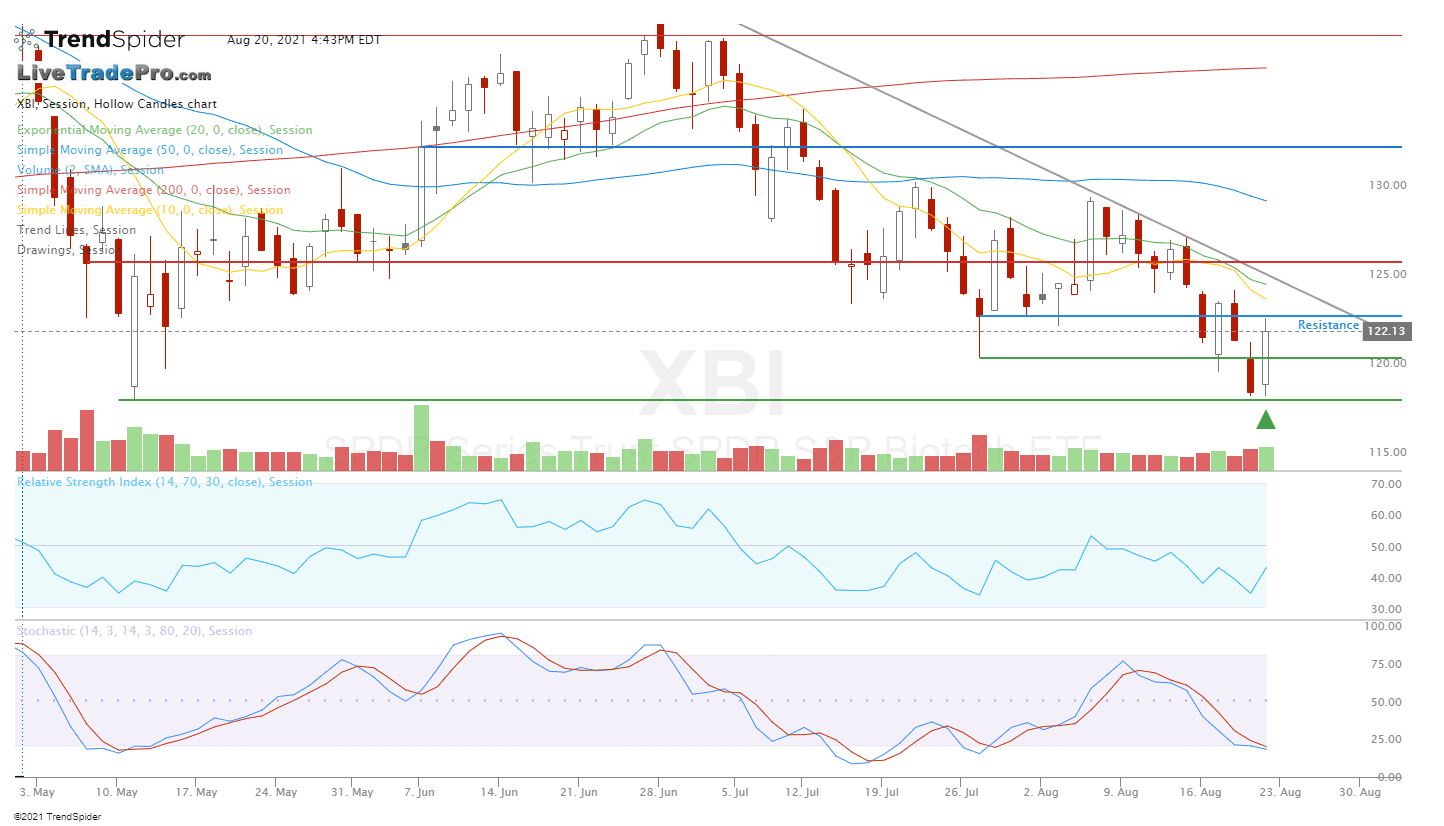
Daily chart Gives more detail on key pivot point overhead
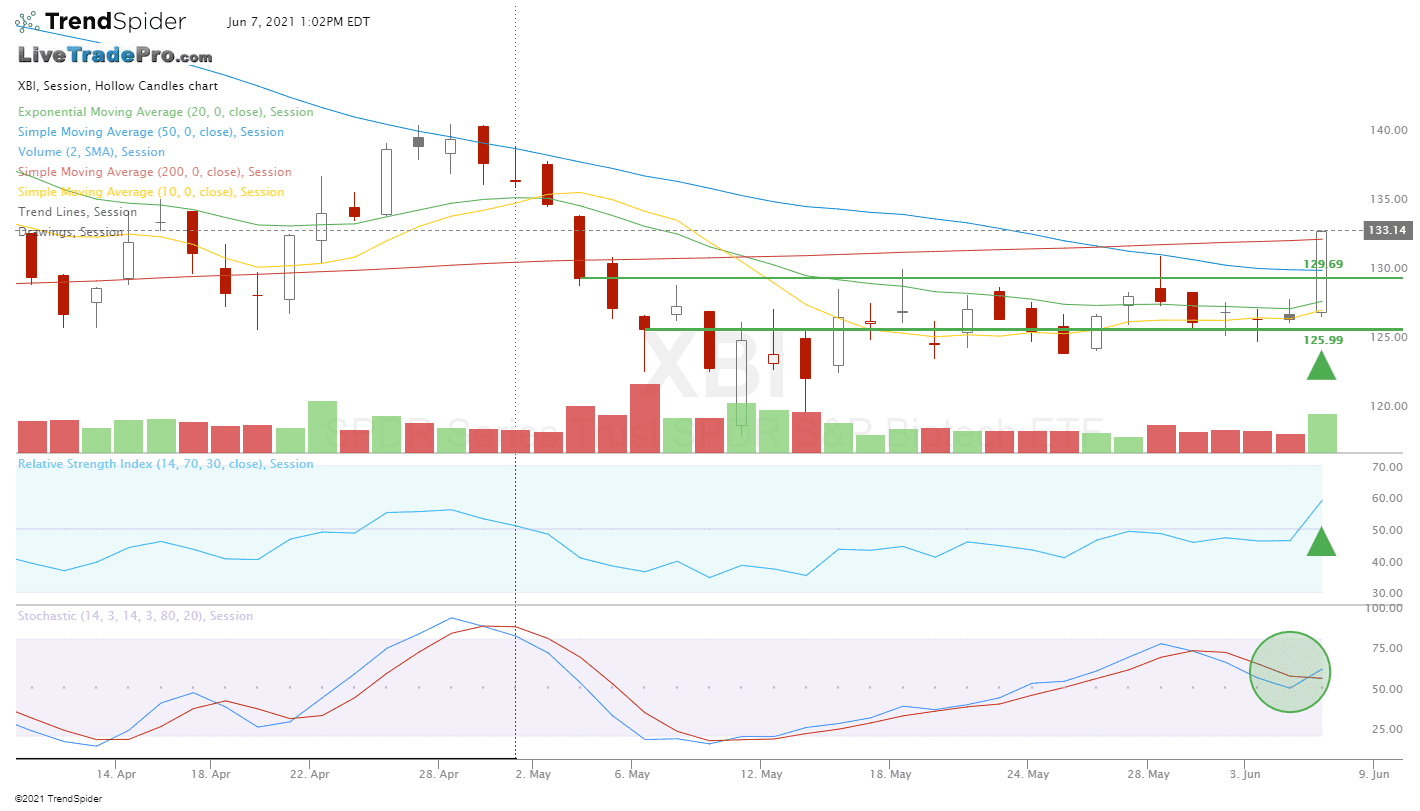
XBI June 7, 2021
During market hours>> Basing Potential breakout
Click on chart to enlarge (to see more clearly)

Chart updated (after the close)
A strong move here now; pushing back above both the 50 and 200 day moving average; on increased volume. Could certainly go higher.