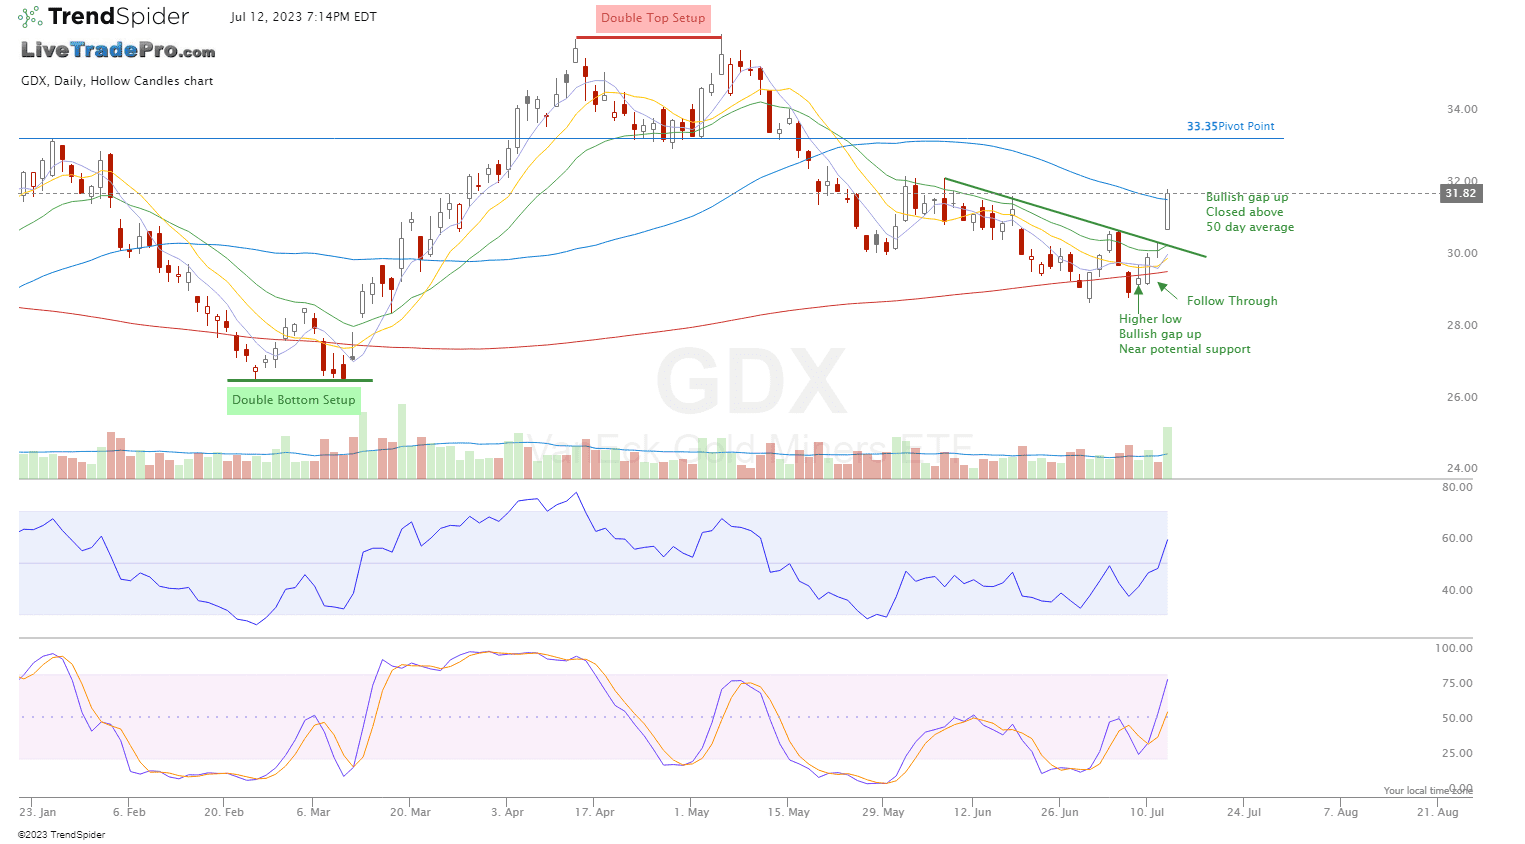
GDX July12th, 2023
GDX NUGT GLD A strong day for gold stocks, confirming bullish expectations.
Bounced off support Closed above the 50 moving average Volume worth noting
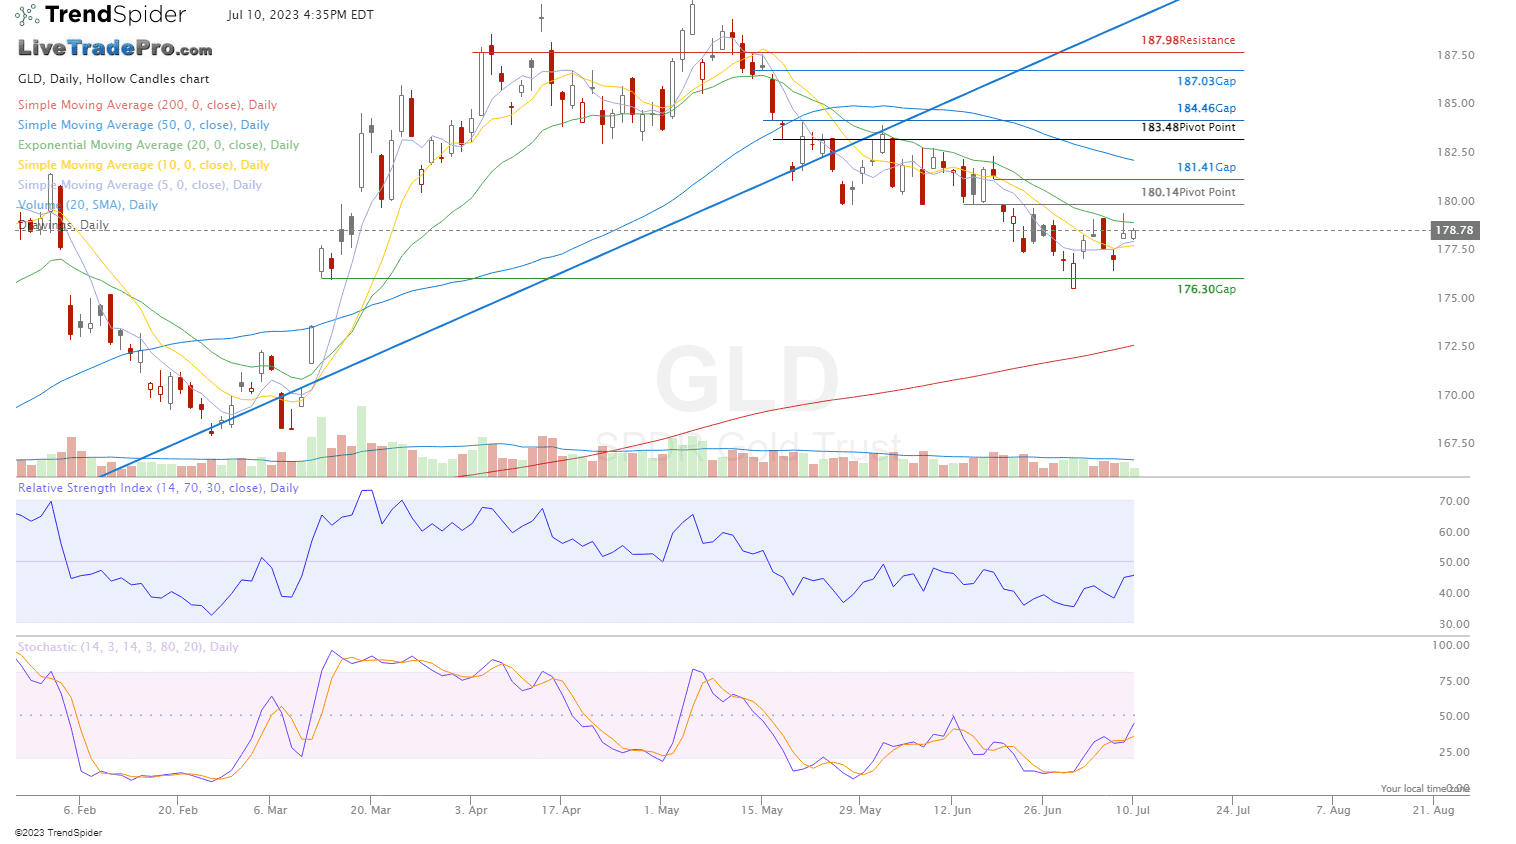
GLD July 10th, 2023
GLD Gold V Bottom (reversal) Setup. This Inverted Hammer candlestick, followed by this green close today is a good start, giving some good initial confirmation of the setup.
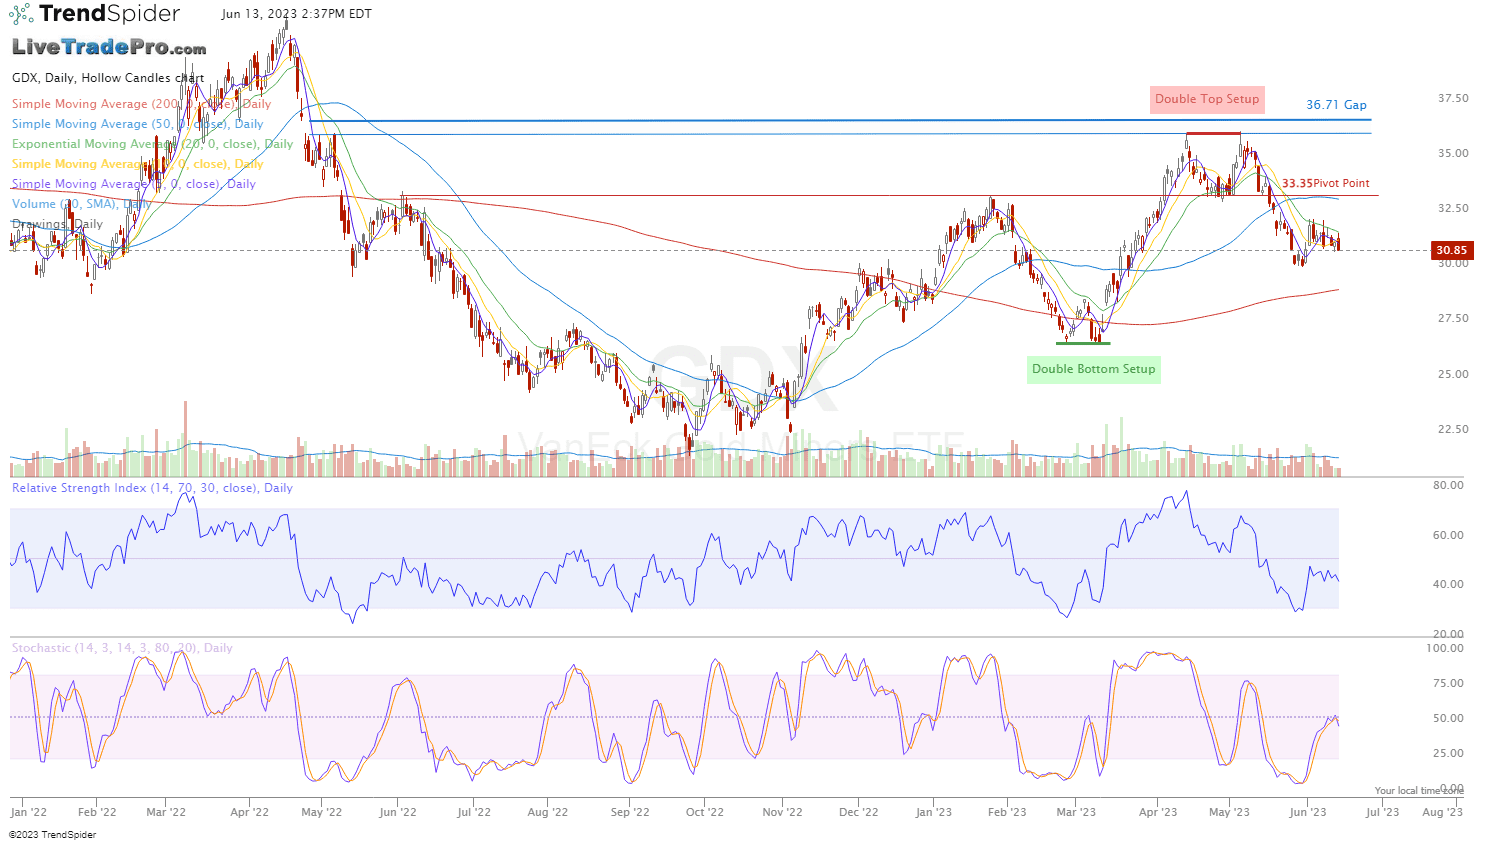
GDX June 13th, 2023
GDX I Continue to avoid gold (mining) stocks here
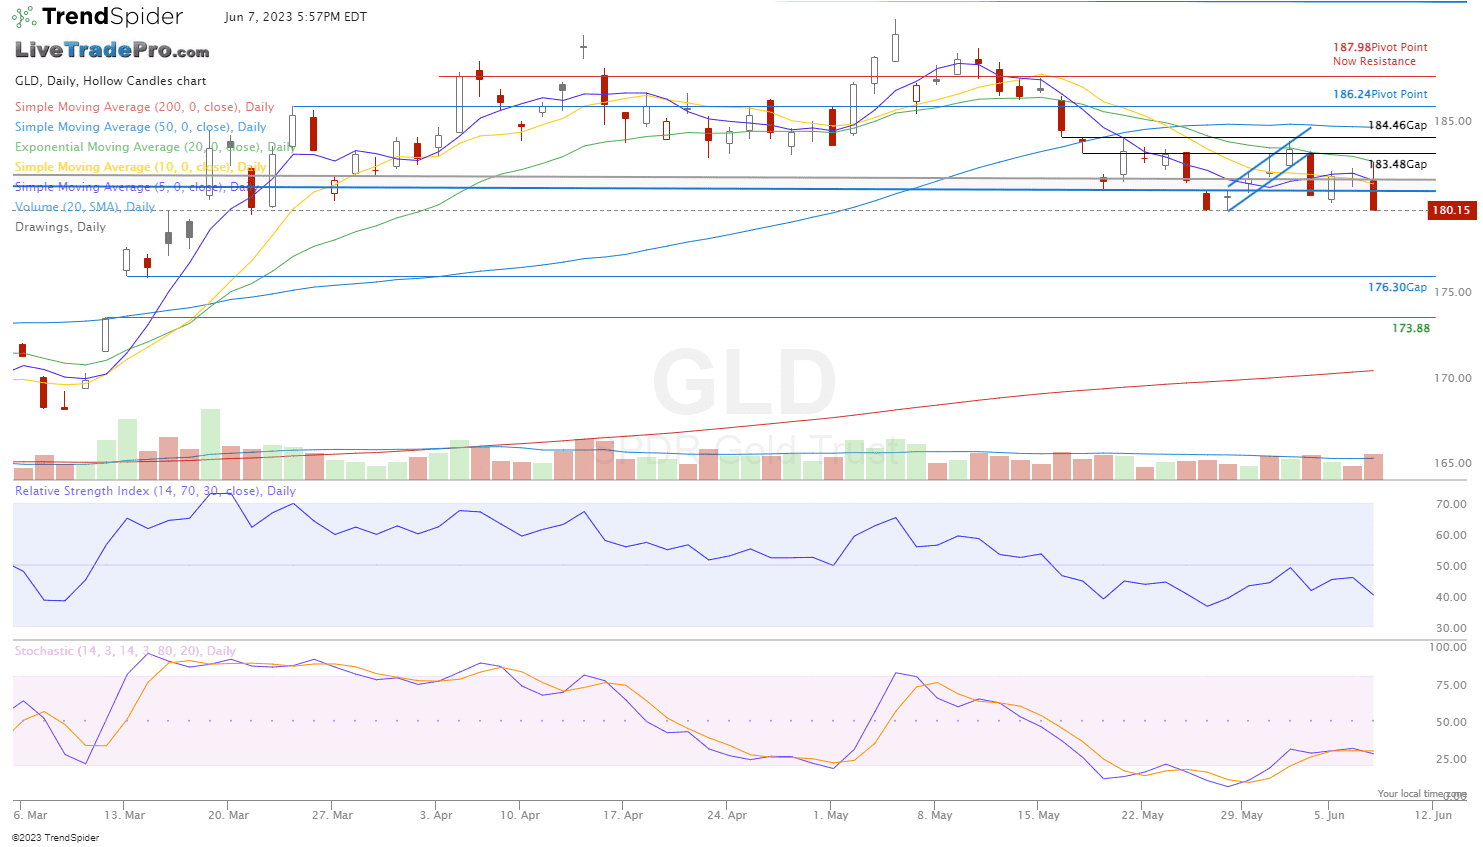
GLD Jun 7th, 2023
GLD Gold Still best to avoid in my opinion as every rally continues to get sold into.
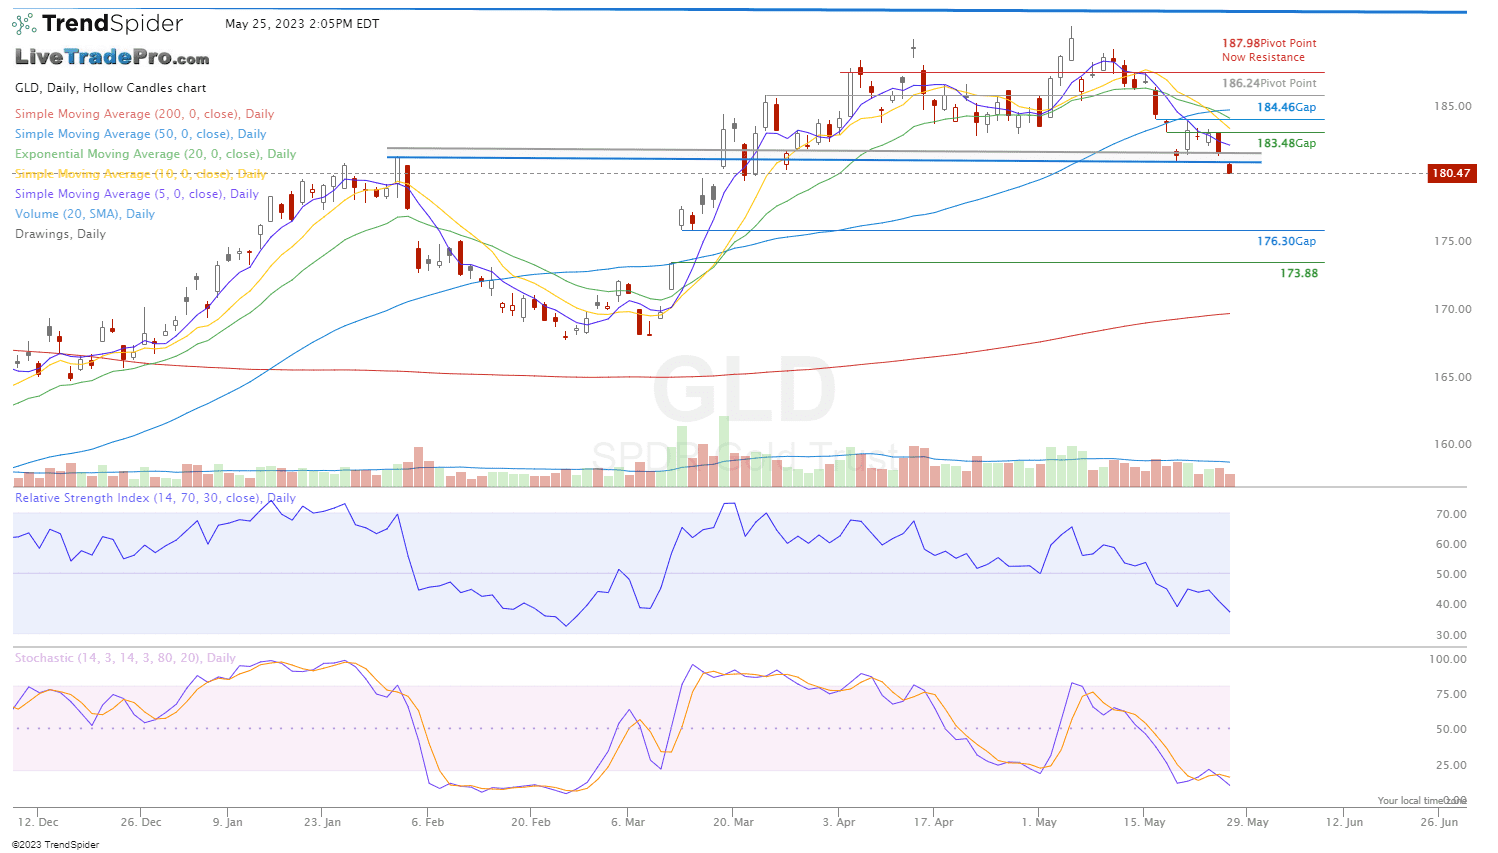
GLD May 25th, 2023
GLD Continues to breakdown.
If you’ve been following my Free updates (swing trade ideas) on gold stocks you’re probably ahead of most others.
See more below
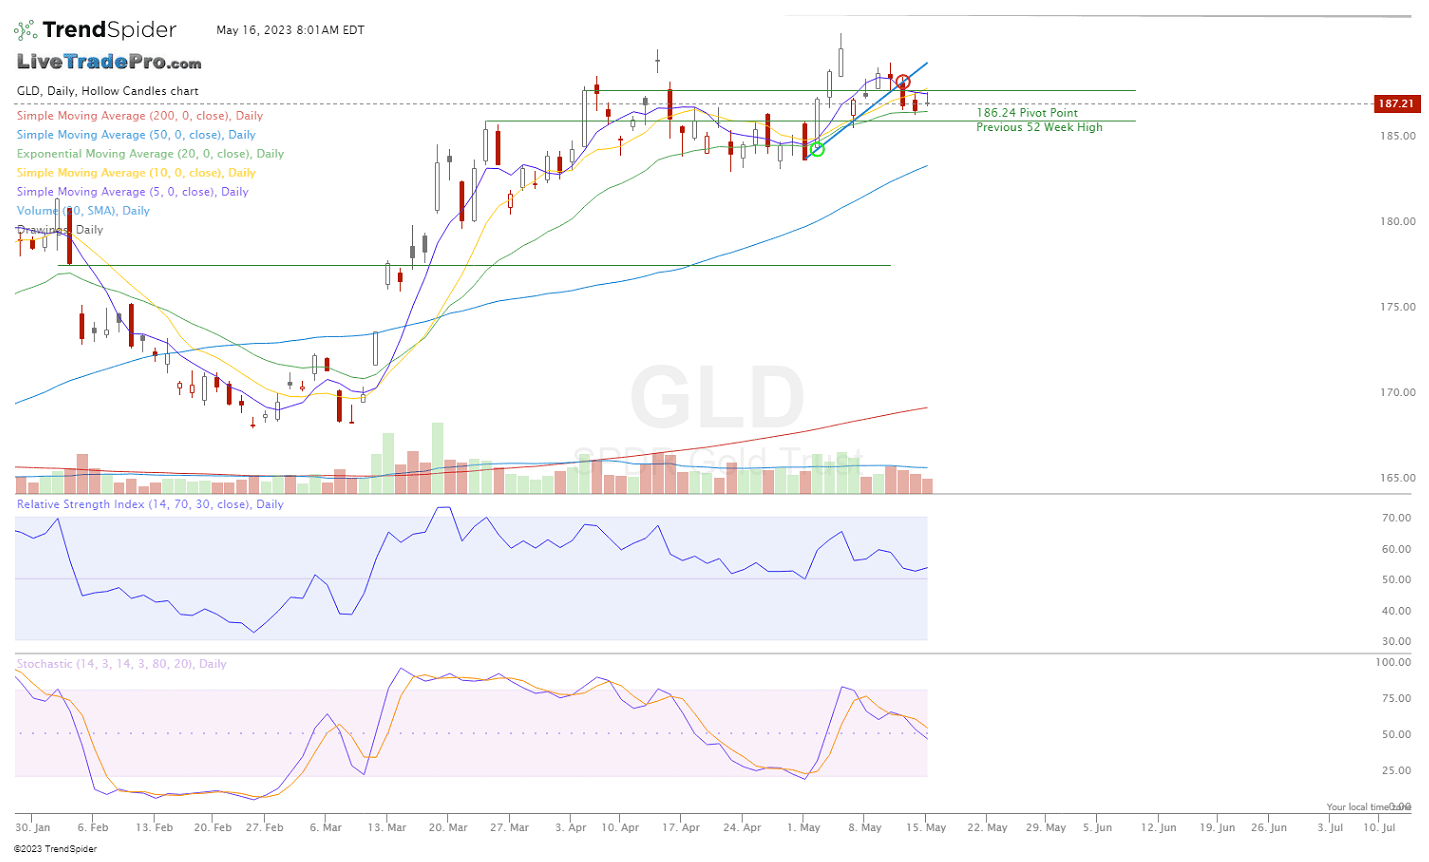
GLD May 15th, 2023
GLD Gold Once again rejected at resistance.
A breakdown under the previous 52 week high at 186.24 would be good intial confirmation that this now continues lower.
Also worth noting are these small green and red circles to help guide the trading process, automatically. You can learn more here about the charting software that I use every day.
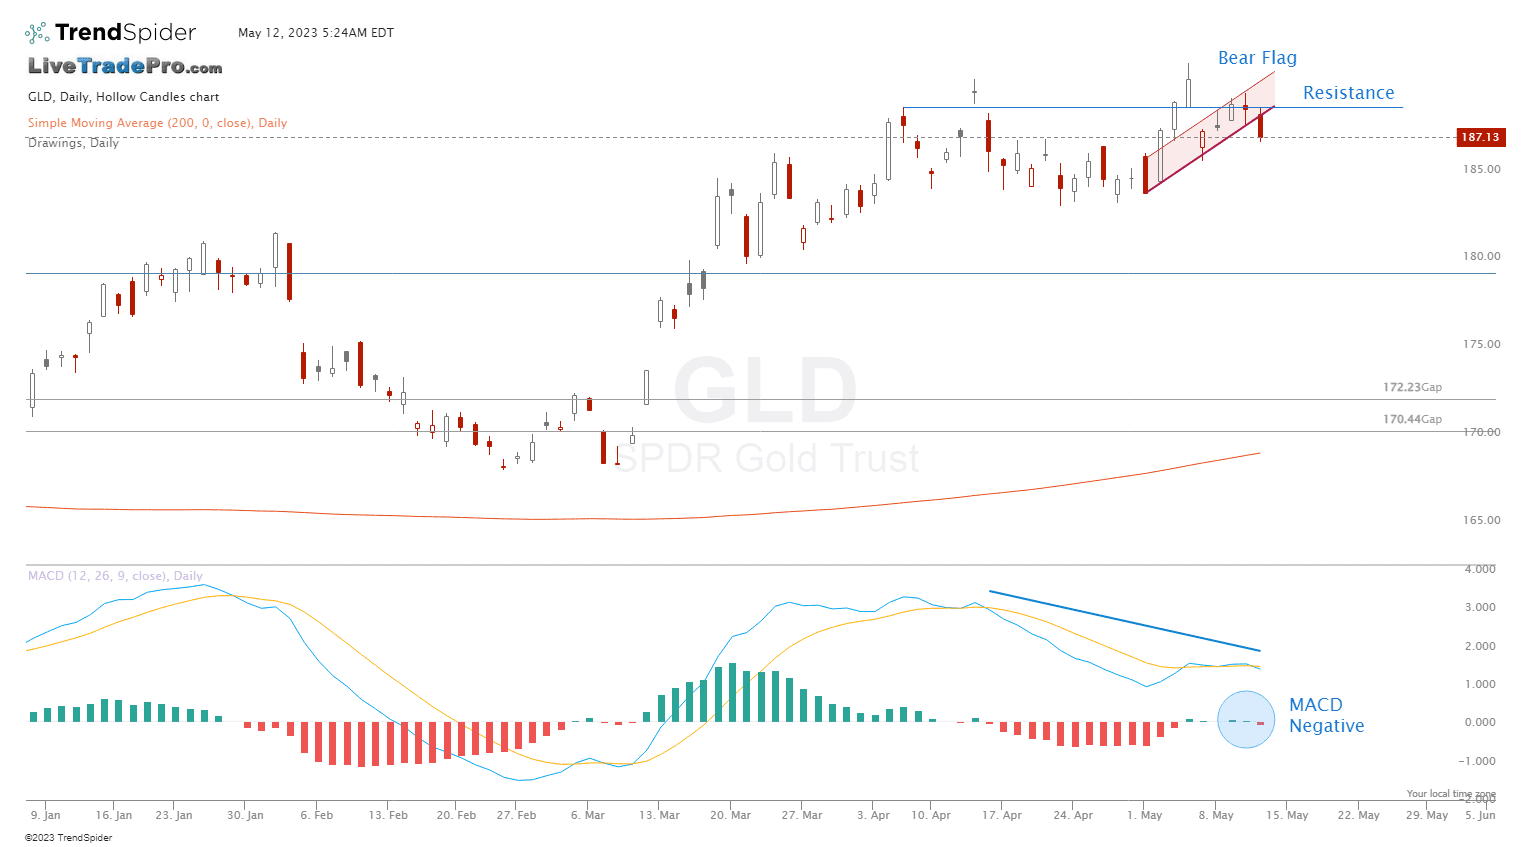
GLD May 11th, 2023
As posted yesterday on social media, I was suspicious of the overall action on gold stocks. The end of the session confirmed the bear flag setup. Along with everything else that I’m seeing, gives me no reason to be bullish on gold at this time. I see strength from the bulls as iffy at best MACD Also worth noting.
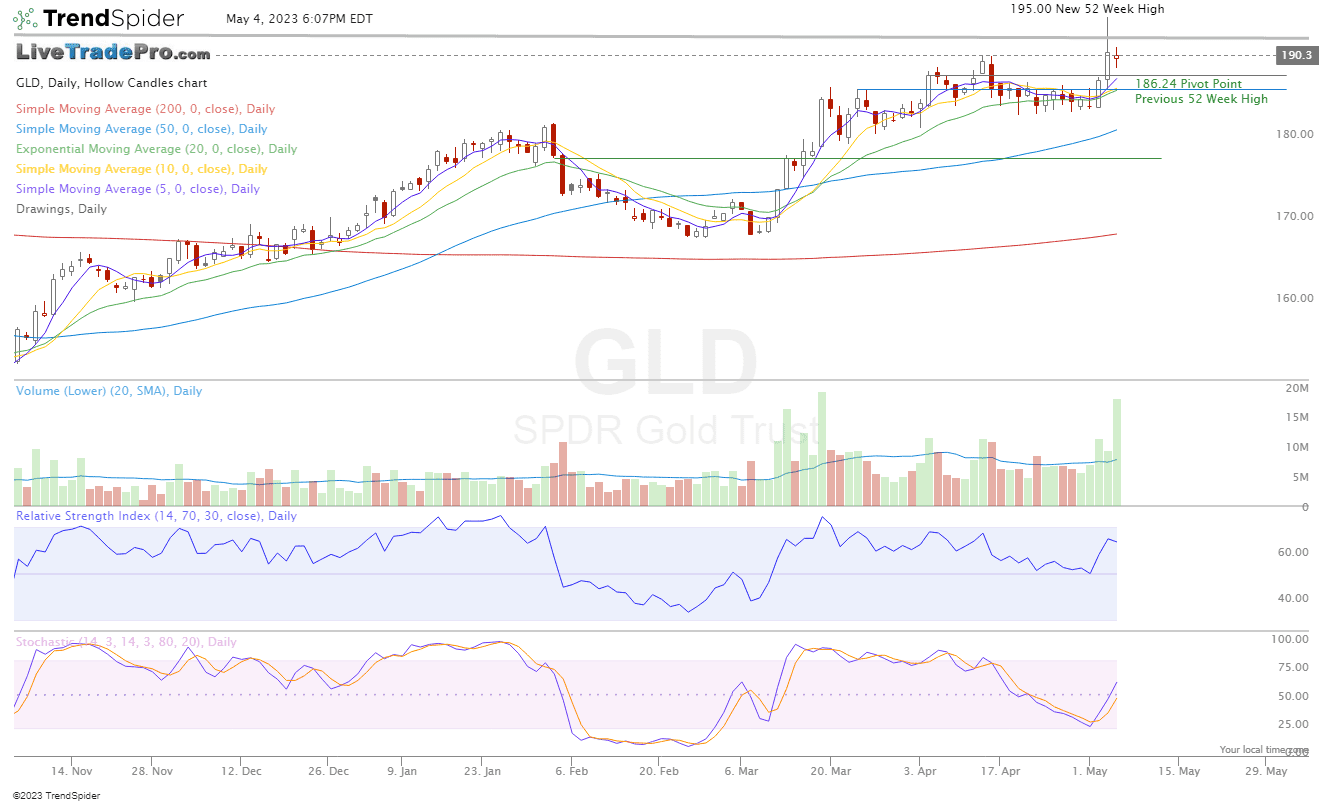
GLD May 3rd, 2023

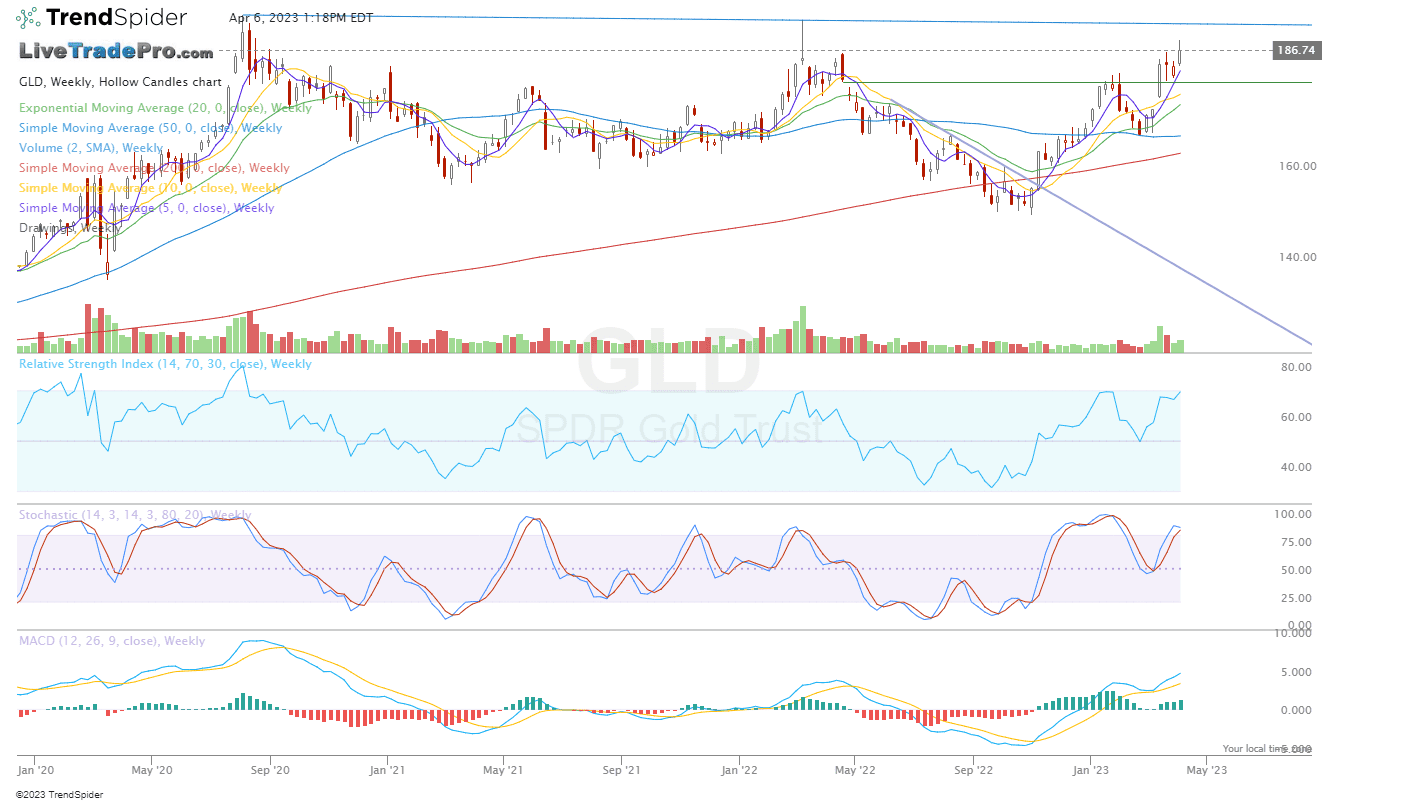
GLD April 6th, 2023
GLD Weekly chart is compelling, and telling me that gold stocks could continue higher. Next key pivot I’m seeing is this higher, down trending blue line. Potential breakout above. Ideally would like to see with increased volume. See what we get.
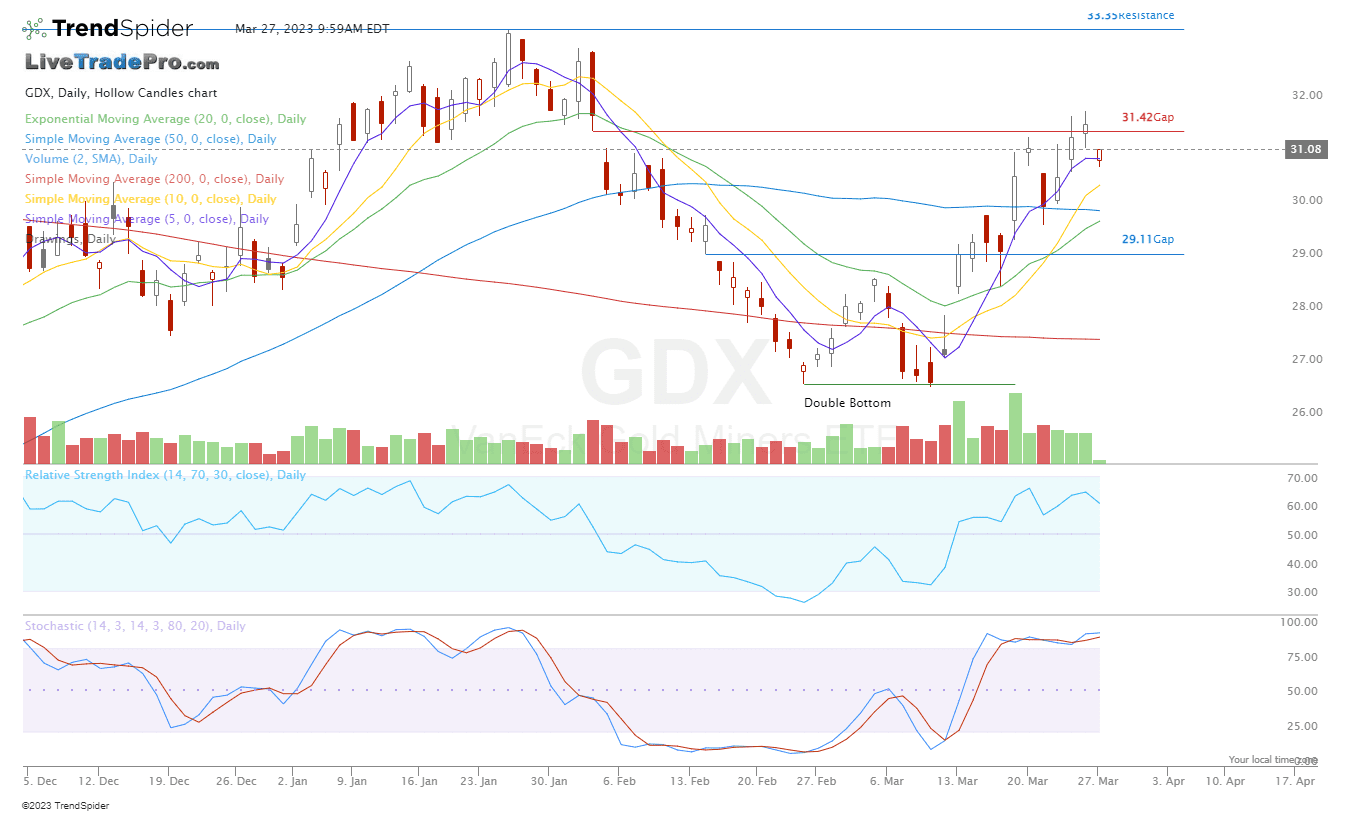
GDX March 27th, 2023
GDX NUGT Gold stocks Drop to pop setup, at support. This hollow red candlestick is attention getting. All about follow through now.