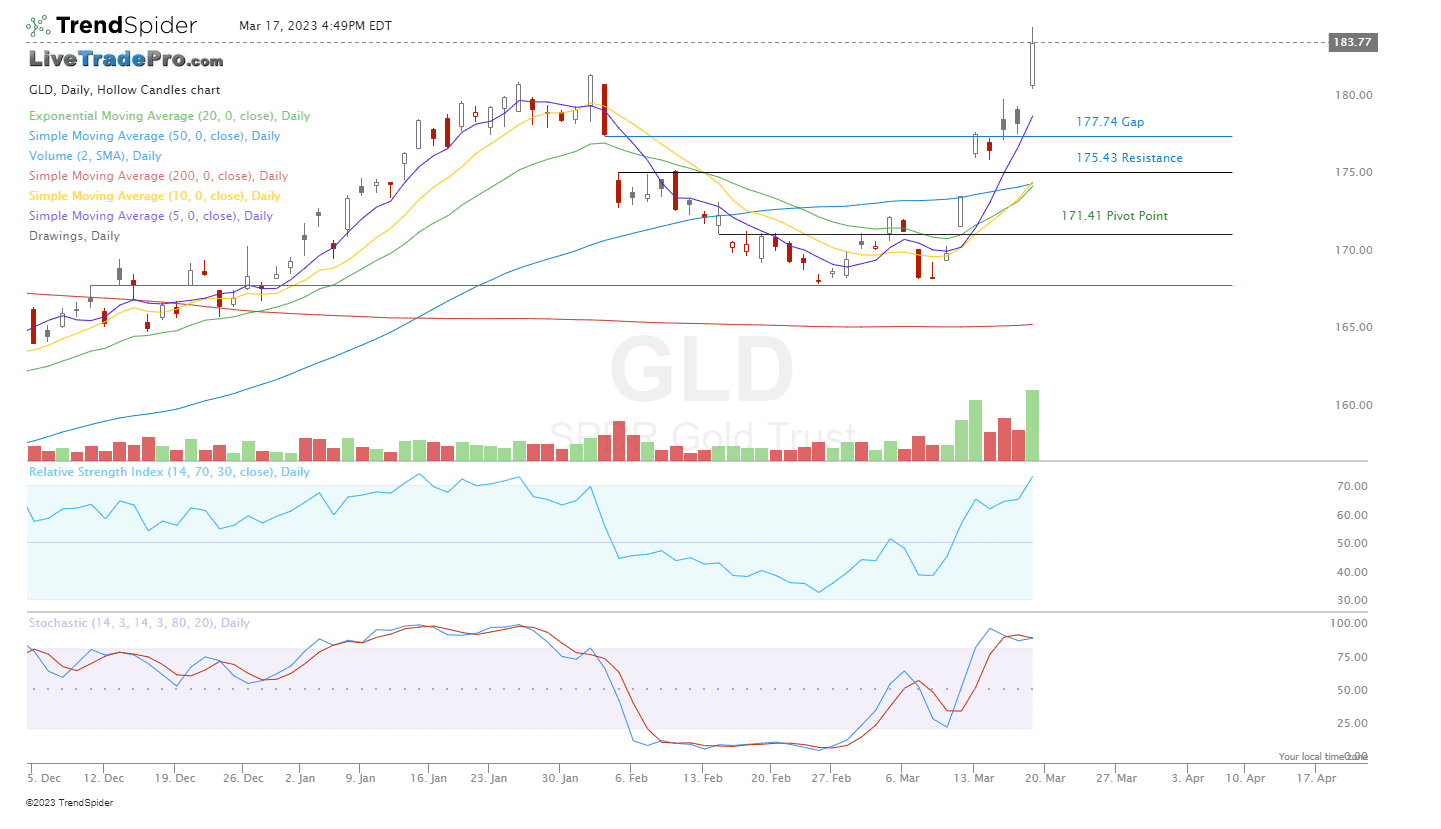
GLD March 17th, 2023

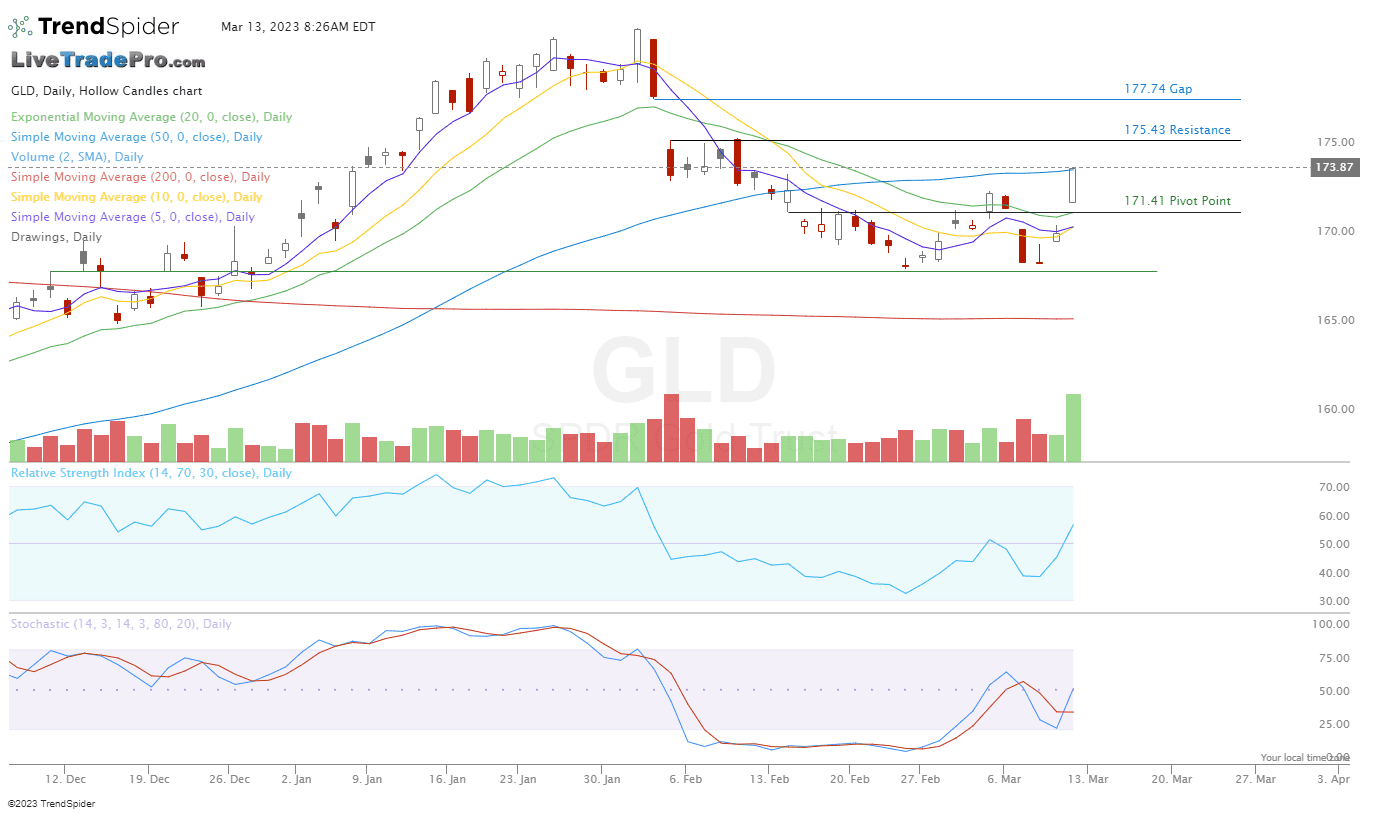
GLD March 10th, 2023
Gold Daily Chart Can’t ignore the bullish gap up today (with volume) closing back above the 50 day average.
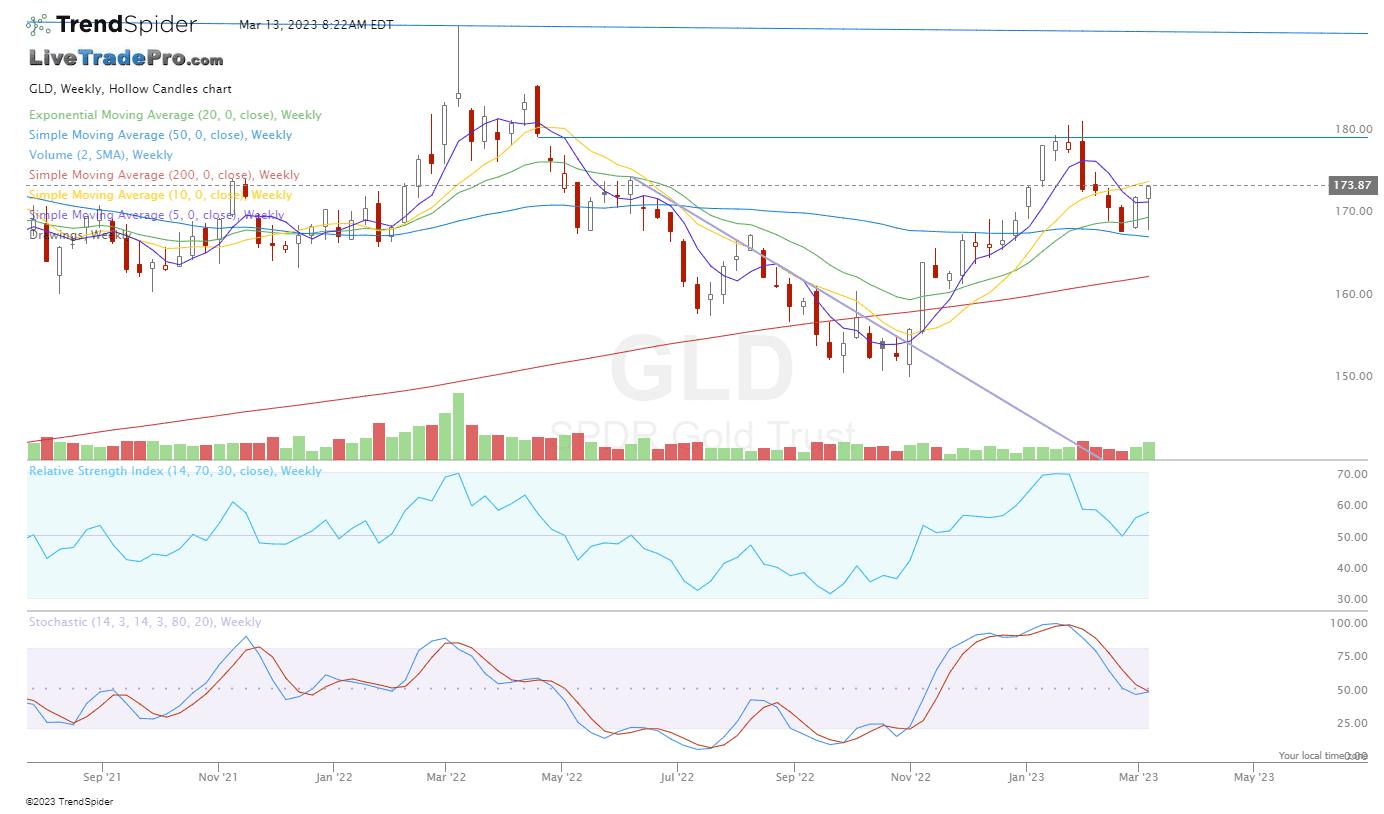
Gold Weekly Chart Liking this reversal attempt at the 50 day moving average.
GDX Gold Stocks March 6th, 2023
GDX NUGT Was a good trade on gold, but thinking this could be a dead cat bounce here and so decided to lock in profit while it’s here to be taken.
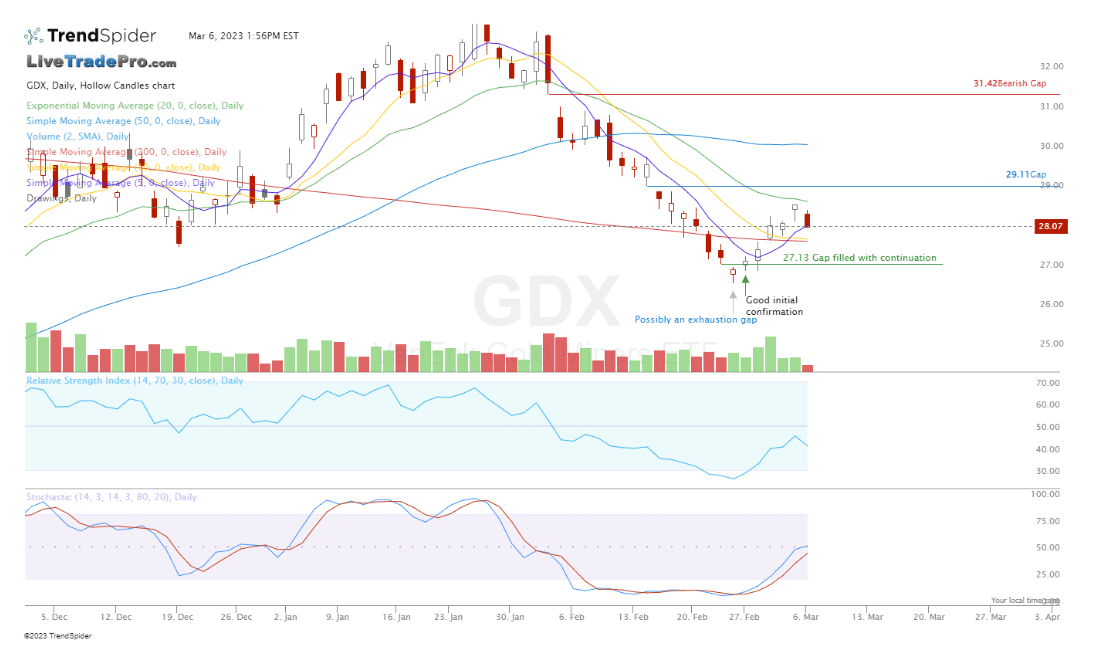
GDX NUGT This plan (to assure profits) worked out nicely indeed.
GDX Feb 28th, 2023
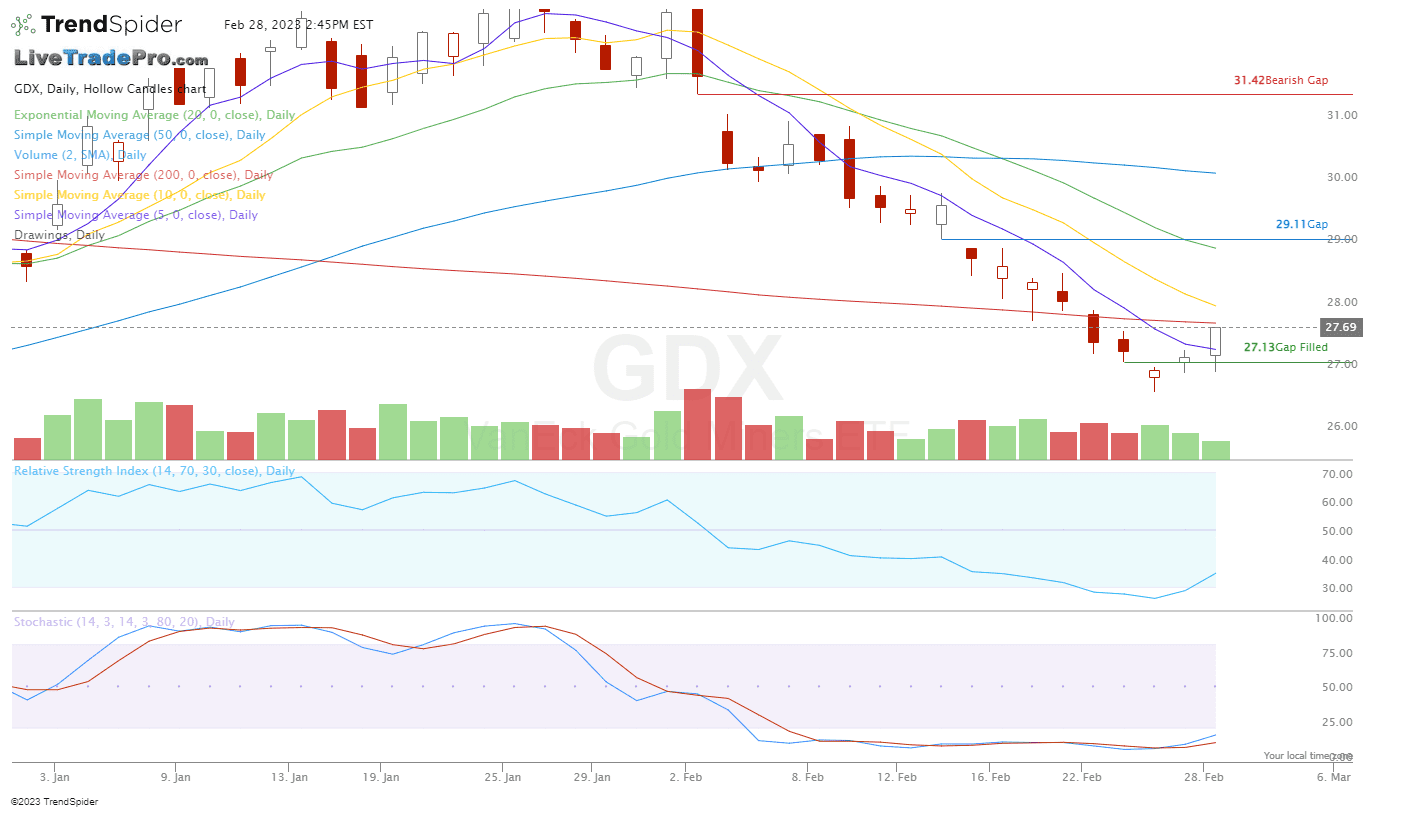
GDX Classic drop to pop setup confirming strength. Continuation higher likely above the 200 day moving average.
GLD NUGT
GLD Feb 27th, 2023
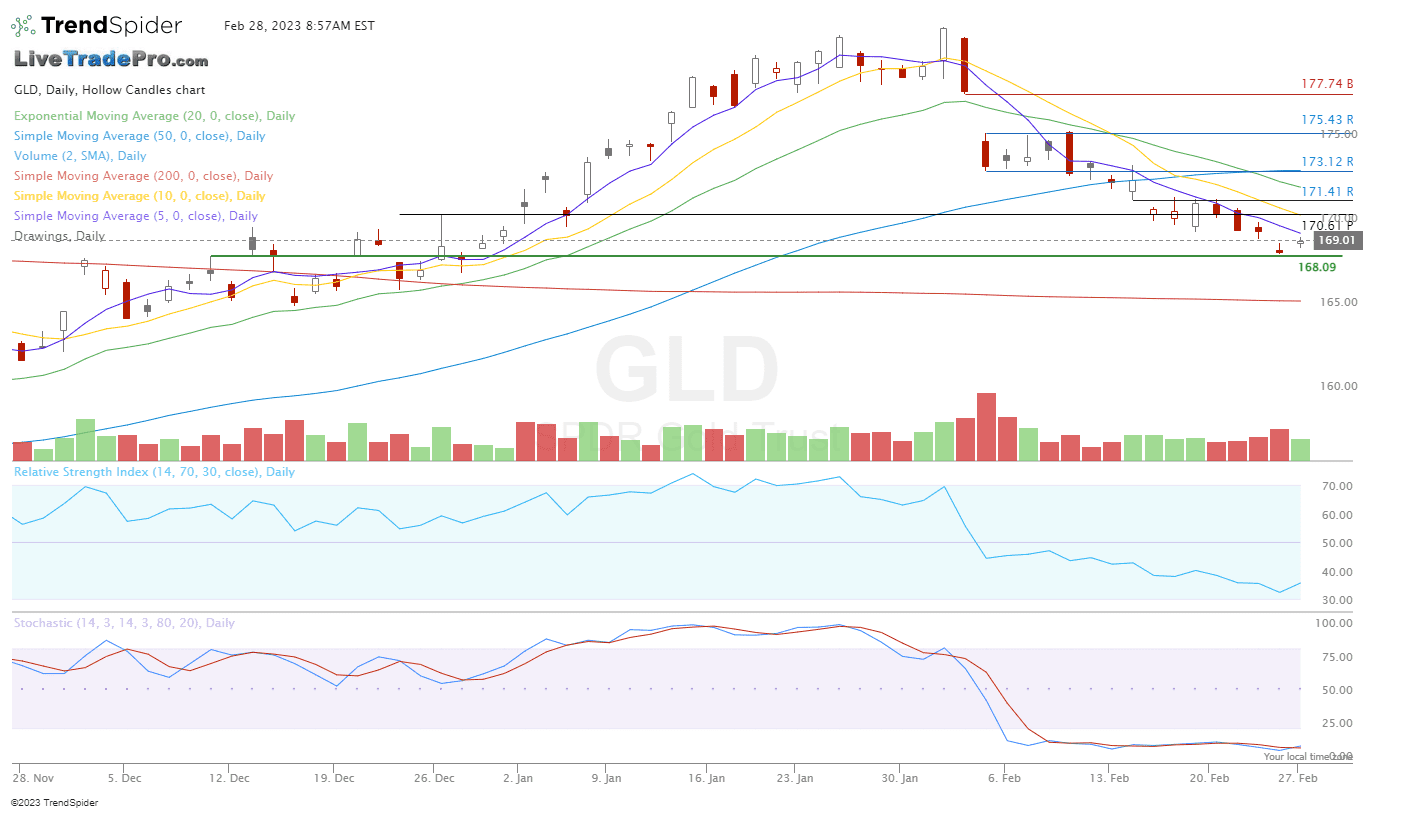
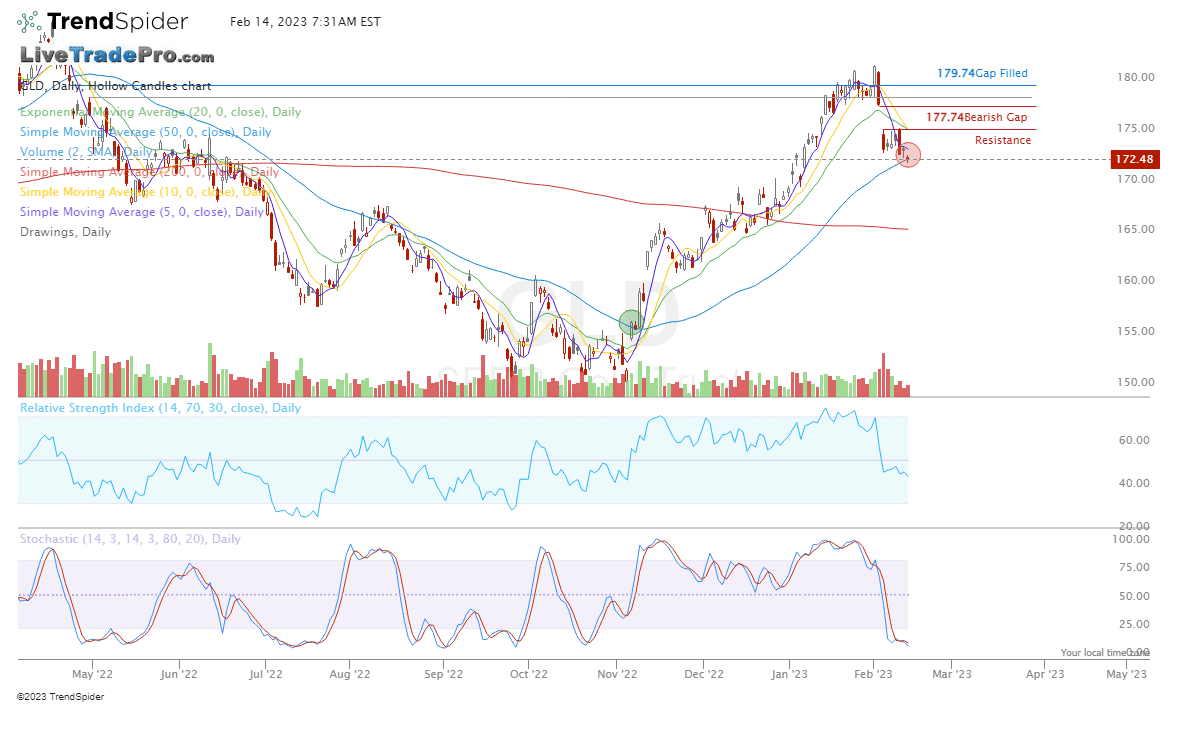
GLD Feb 13th, 2023
GLD Closed under the 50 day average (by 1 penny)
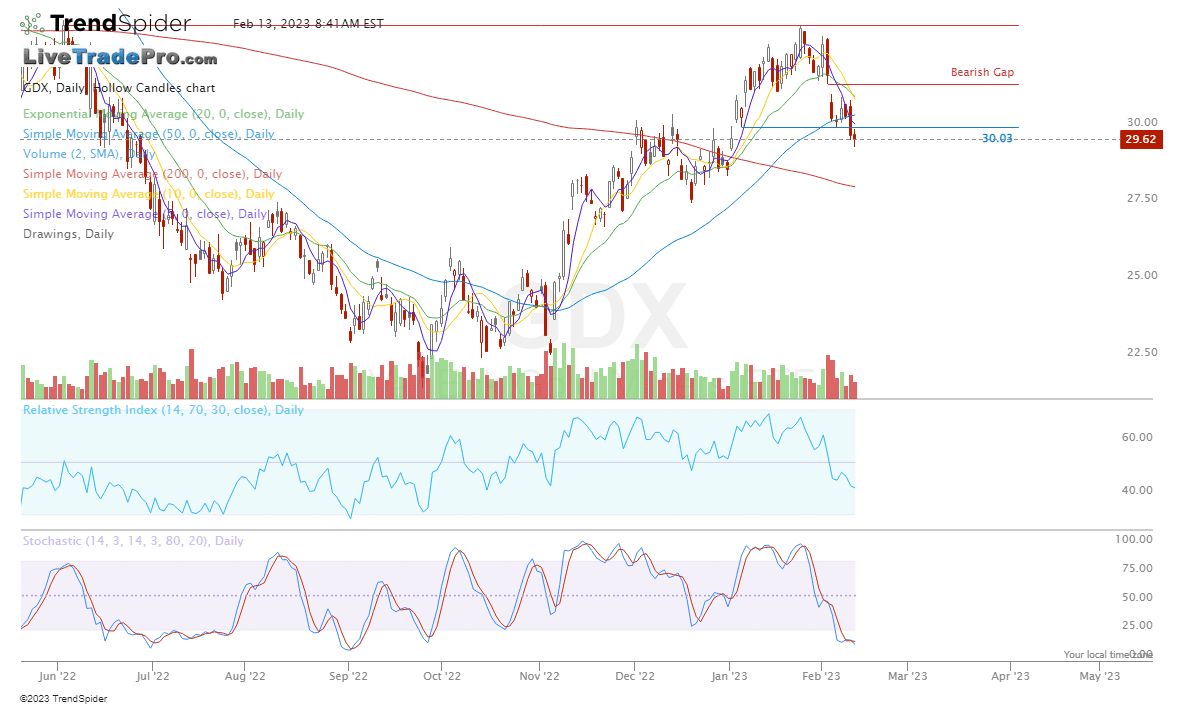
GDX Feb 10th, 2023
GDX Gold mining stocks, breaking down
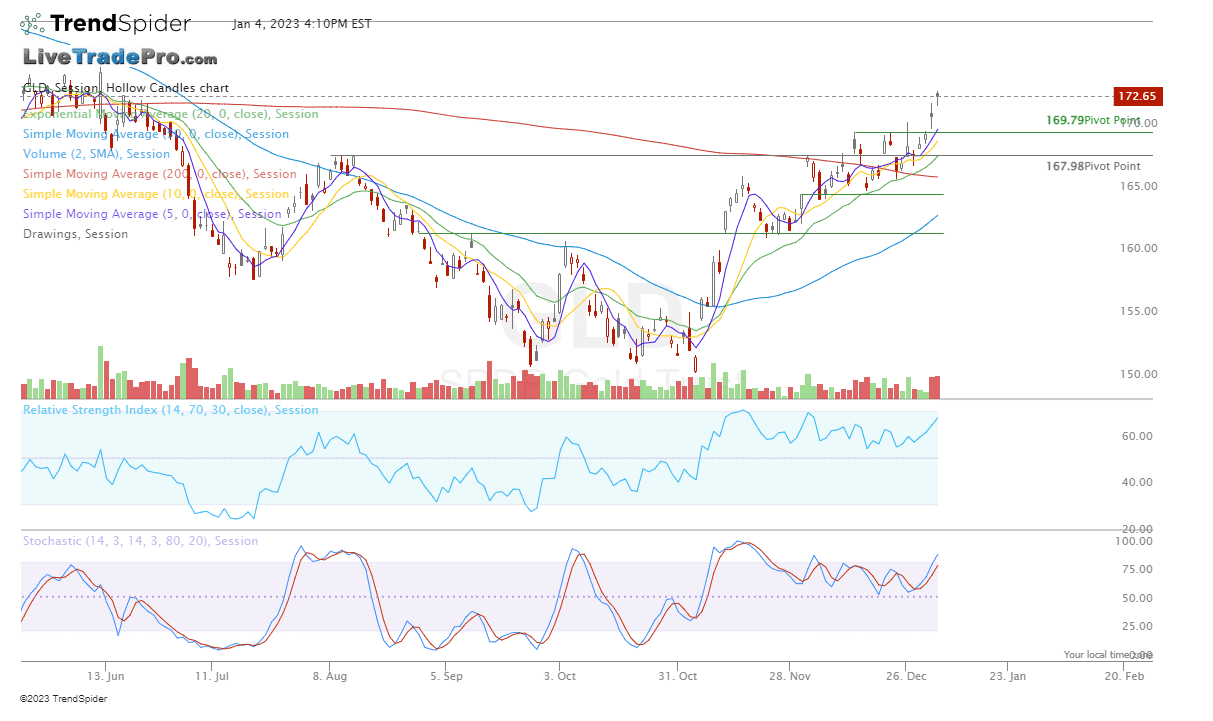
GLD Jan 4th, 2023
Gold stocks continue to breakout to higher levels in the new year.
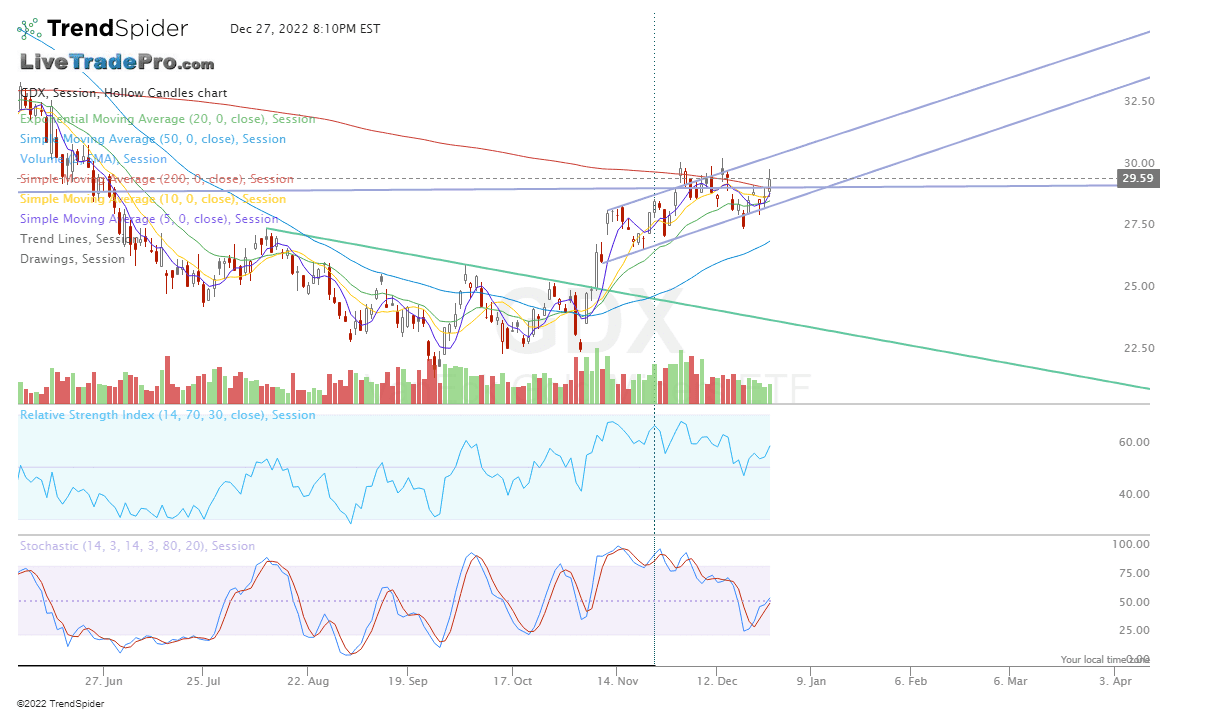
GDX Dec 27th, 2022
Closed above the 200 day average.
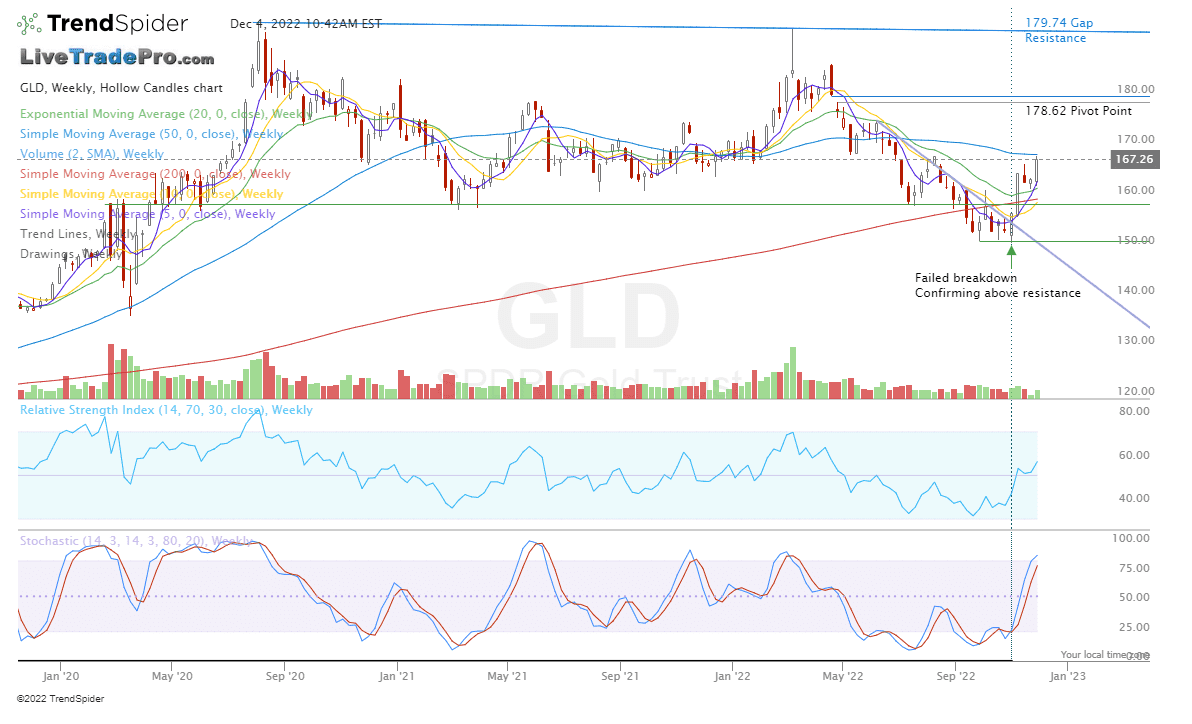
GLD Dec 2nd, 2022
GLD Weekly chart Confirming our bullish expectations (see earlier charts on this setup below)
Note Dec 1st, 2022 Closed back above the 200 day moving average. It’s the first time it’s closed above that since June 16th
Important >> This type of trade may not be for everyone, due to the extreme volatility. Please understand the risk.
See more of my gold charts below to see how I got here.