GLD April 25th, 2022
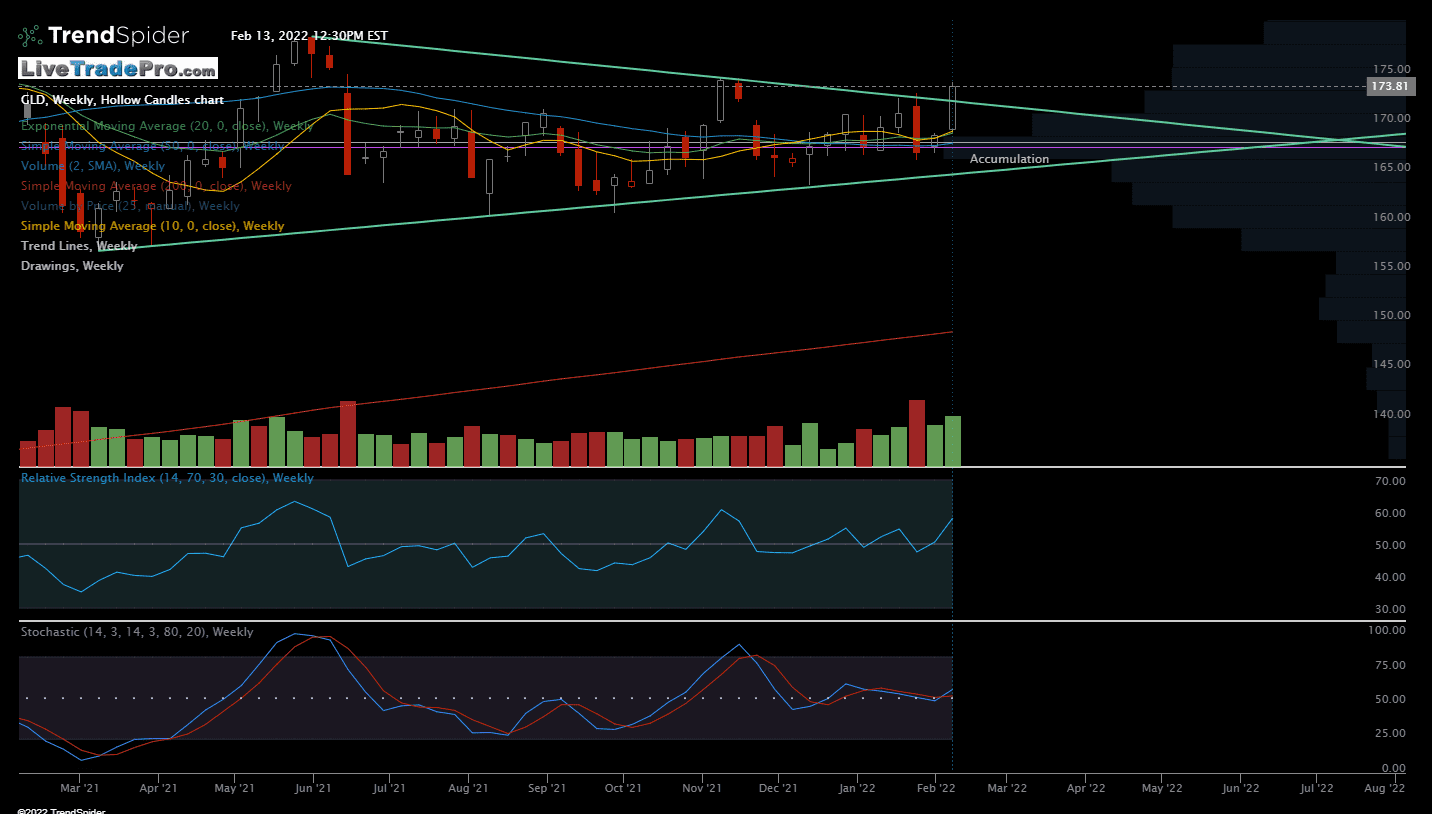
GLD Feb 10th, 2022
Weekly chart
Symmetrical triangle breakout
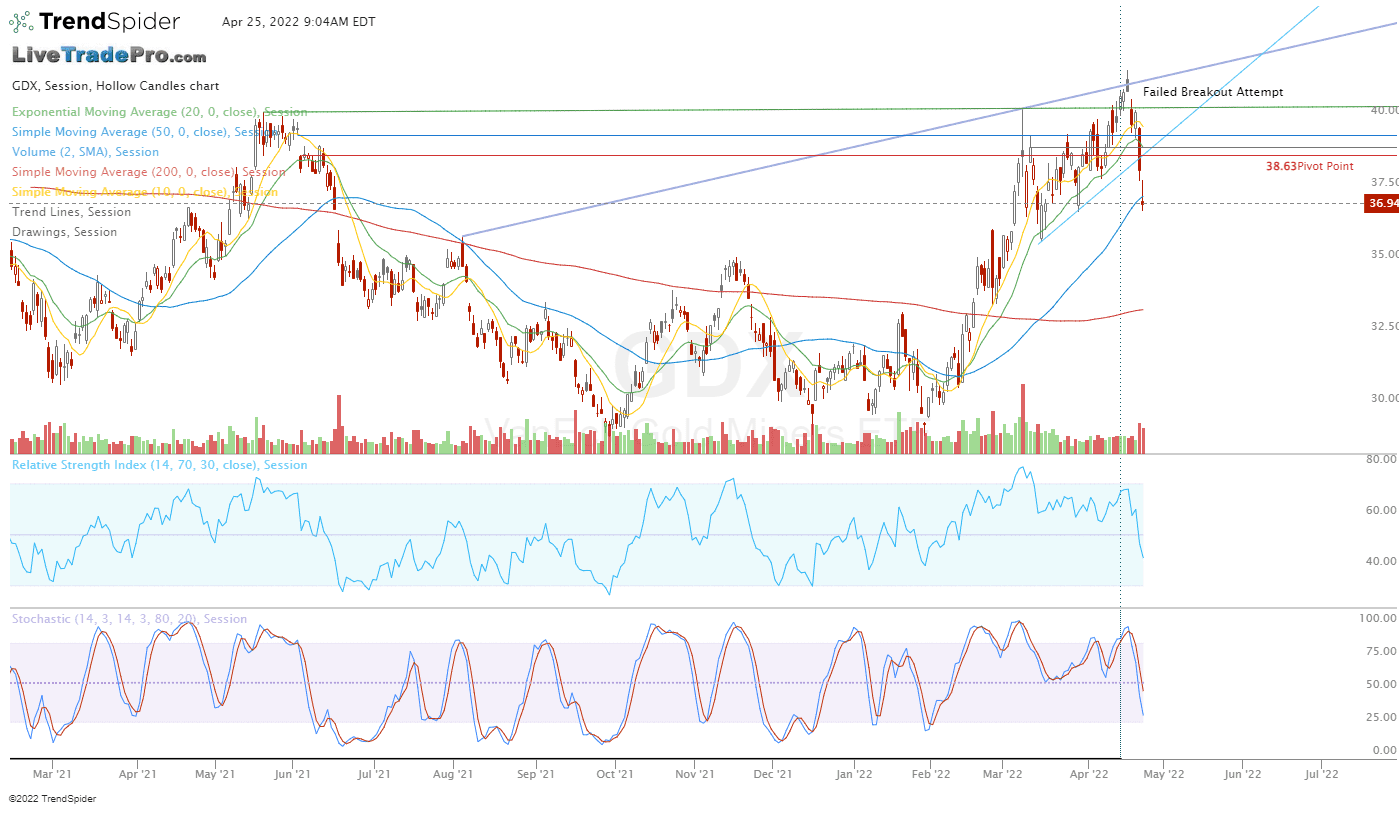
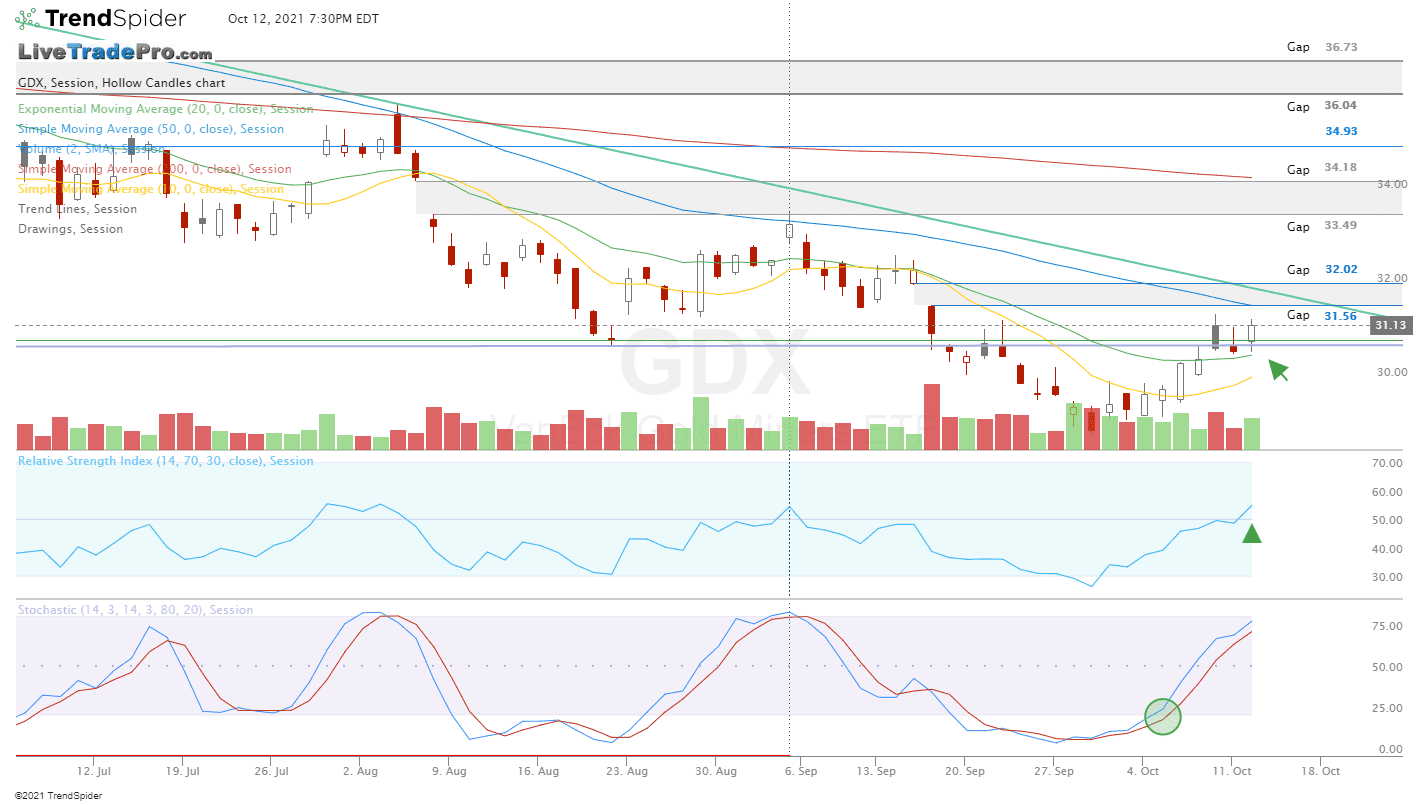
GDX Oct 12th, 2021
Inverted Hammer confirmed nicely today on increased volume, closing above resistance. Looking like this is ready to make a move higher and possibly to fill some higher gaps. Not a predication. Potential breakout above (green) trend line above
GLD Jun 9th, 2021
Direction seems questionable at this time No position
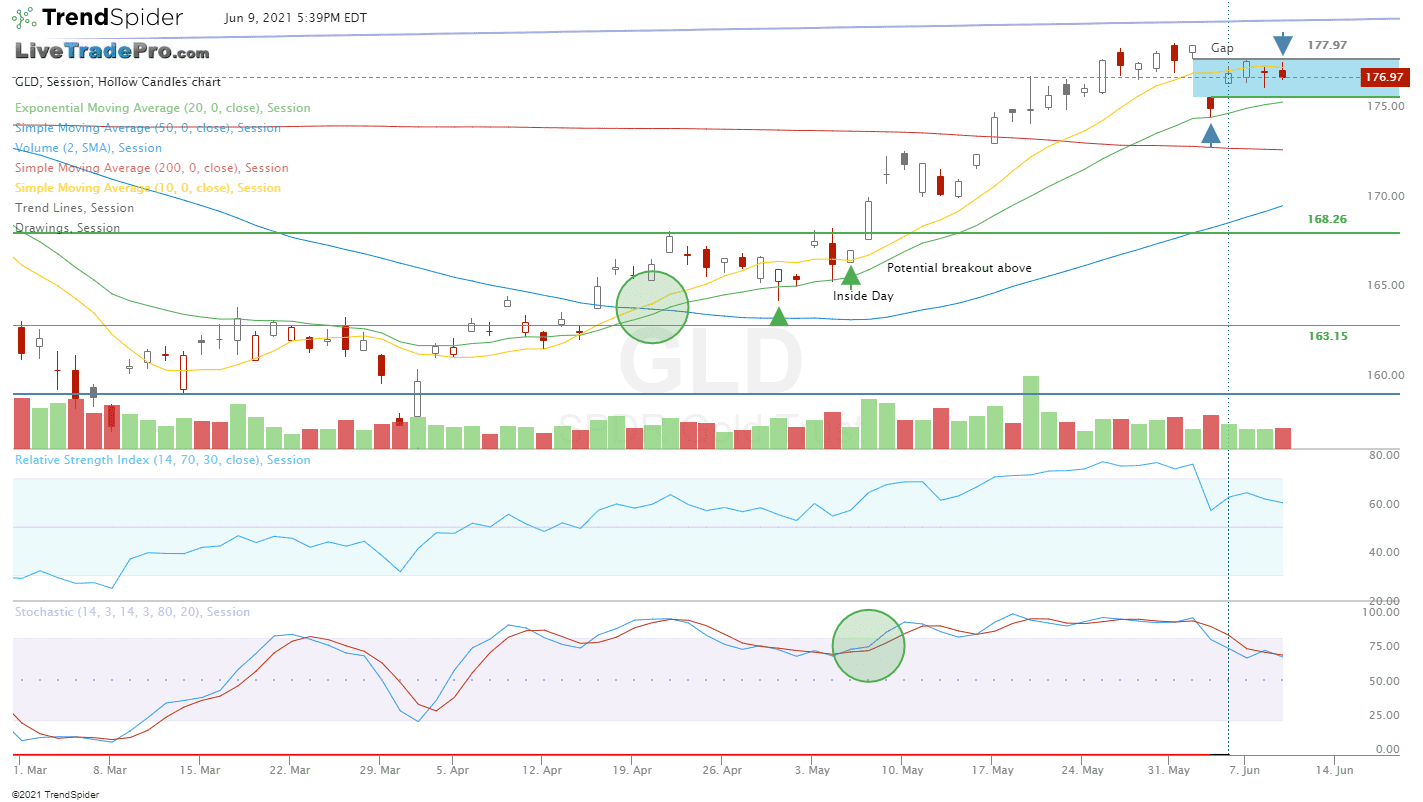
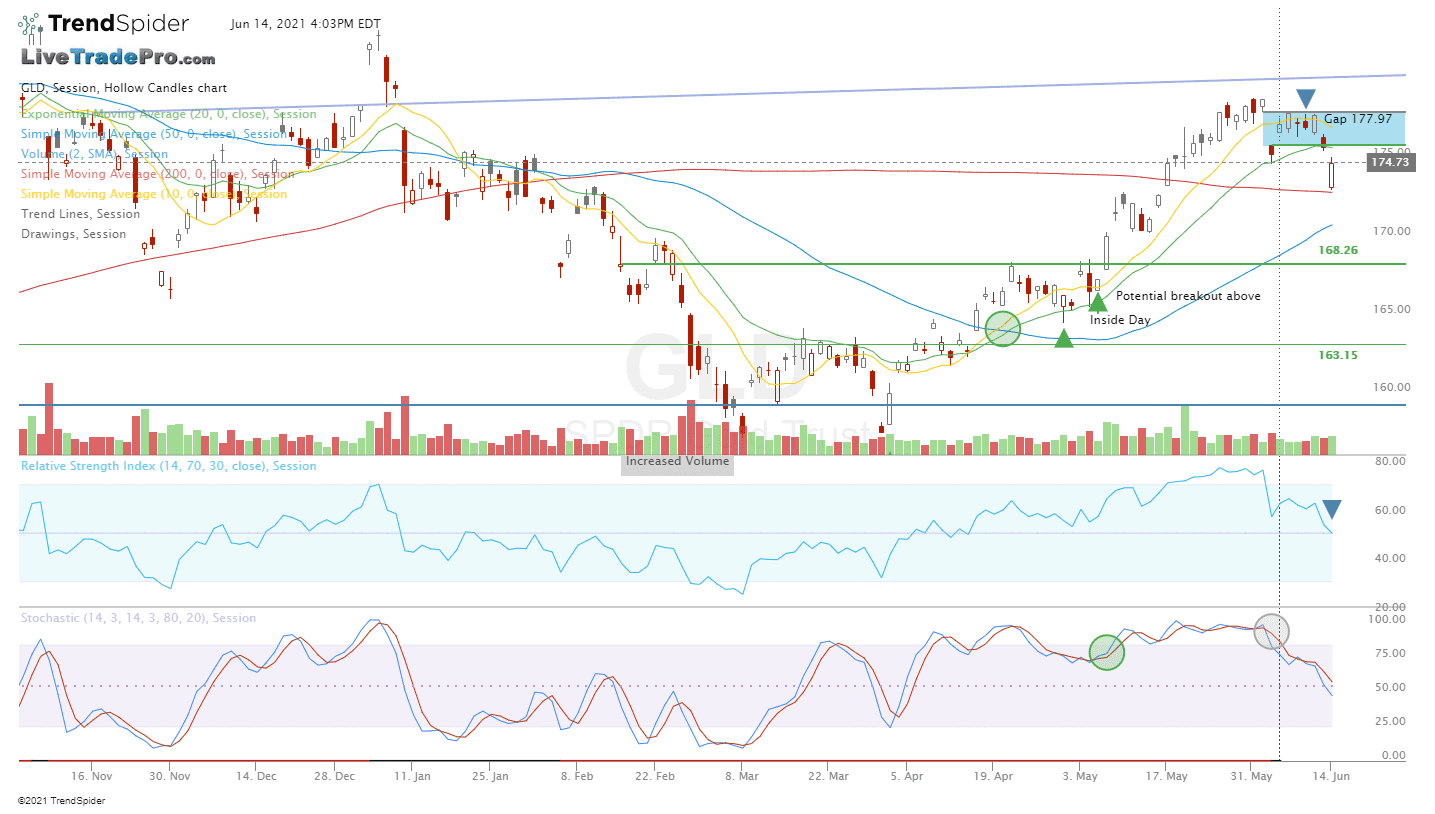
Update June 14th

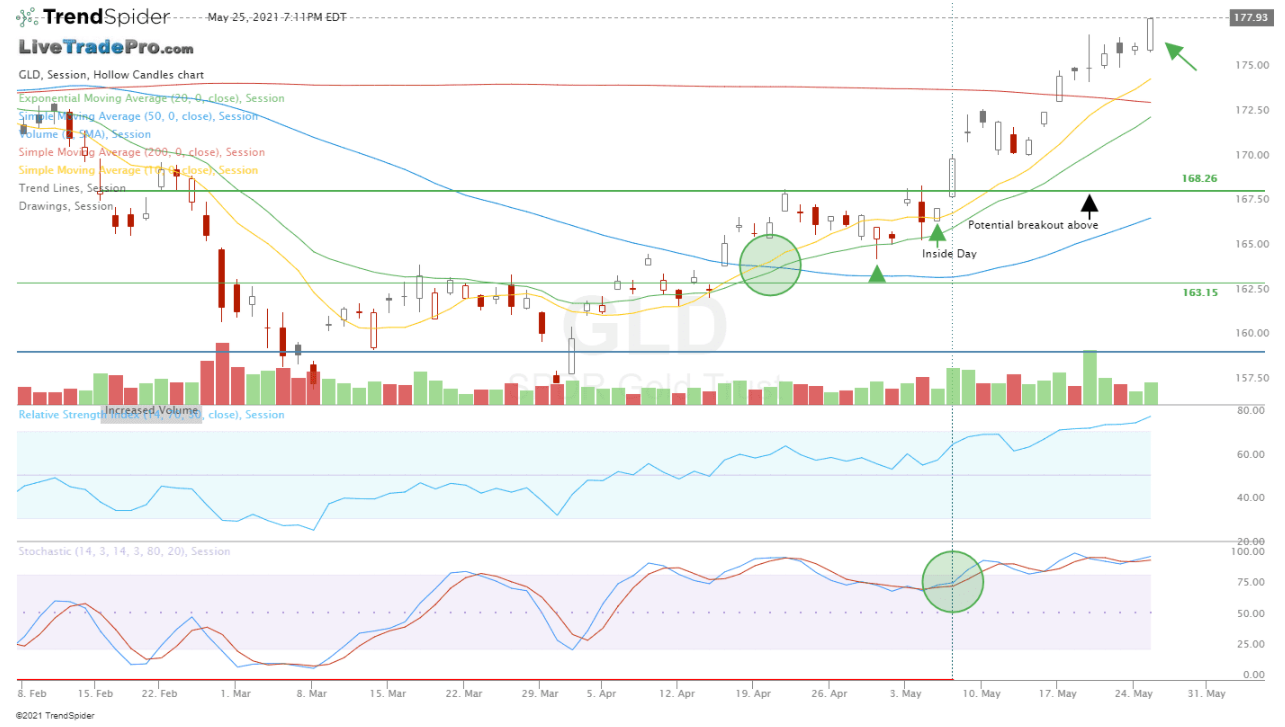
GLD May 25th, 2021
Did you see our intial post on bullish expectations? Posted below this chart
Nice continuation!
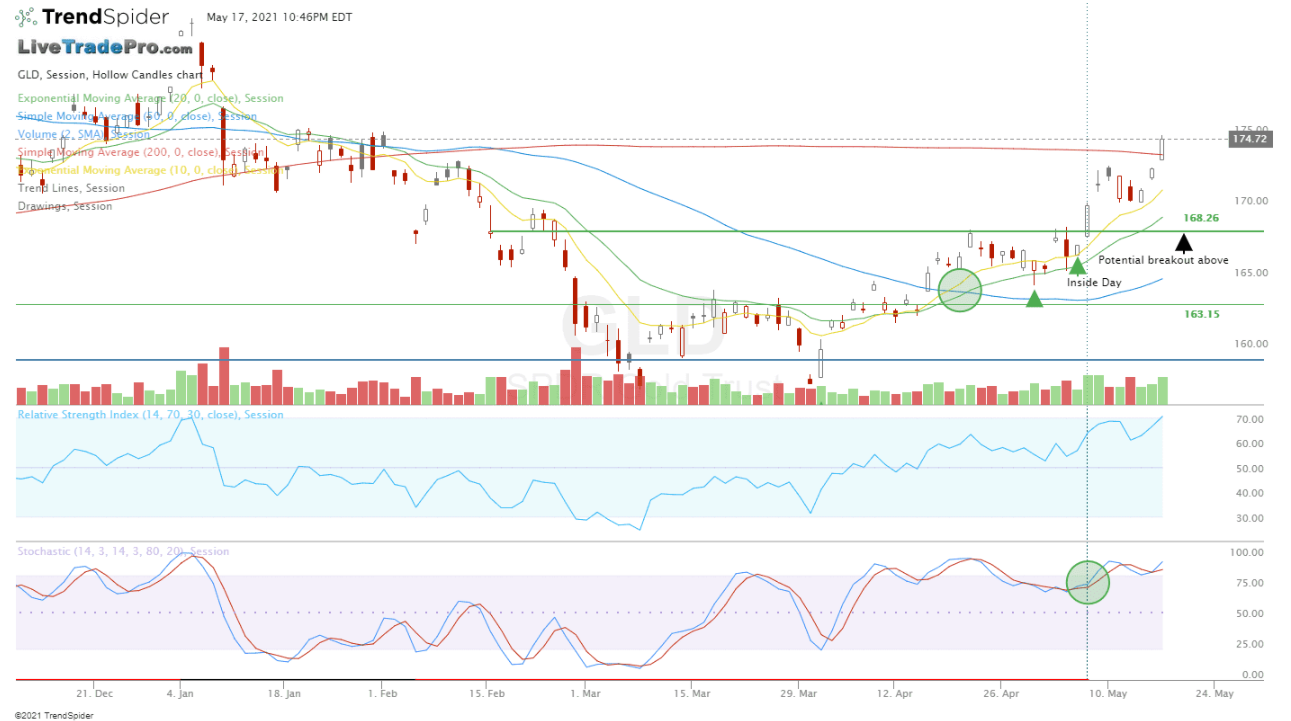
GLD May 17th, 2021
A significant move (signal) for gold today, breaking out above its 200 day moving average on increased volume.
See the setup (before the breakout) below
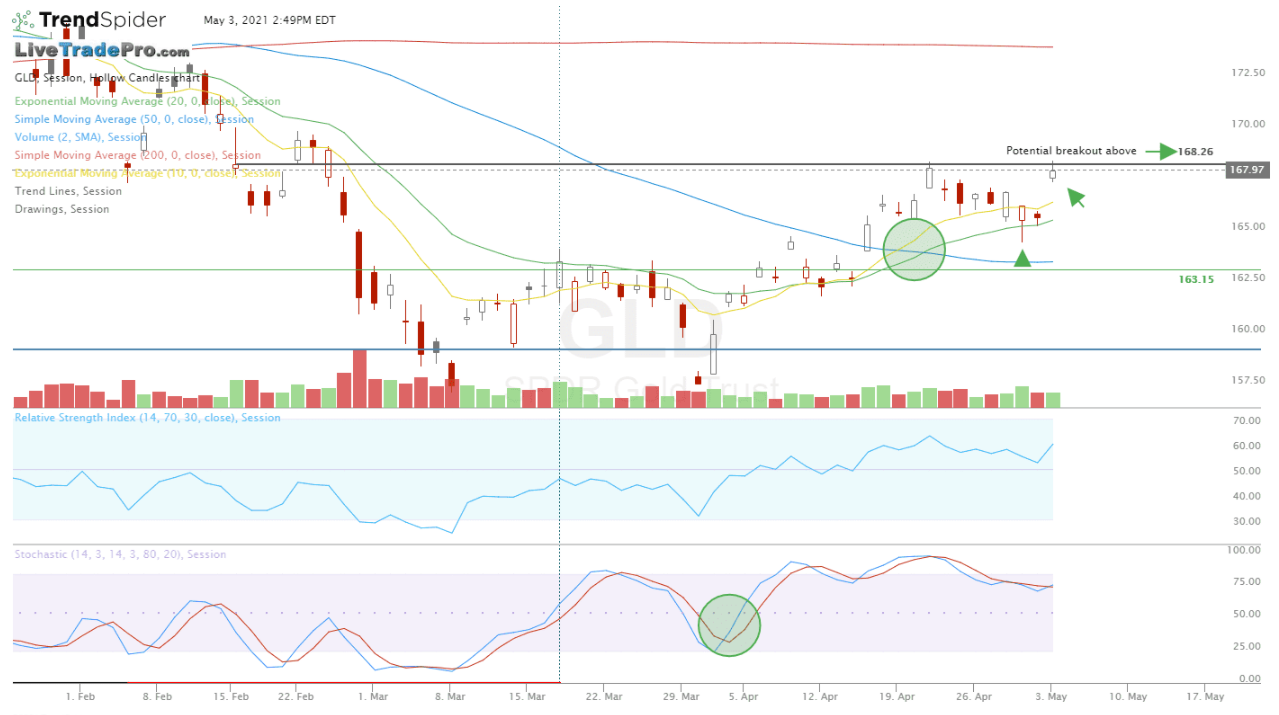
GLD May 3rd, 2021
Reversal?
GLD Feb 4th, 2021
The accident just waiting to happen, happened.
We continue to avoid.

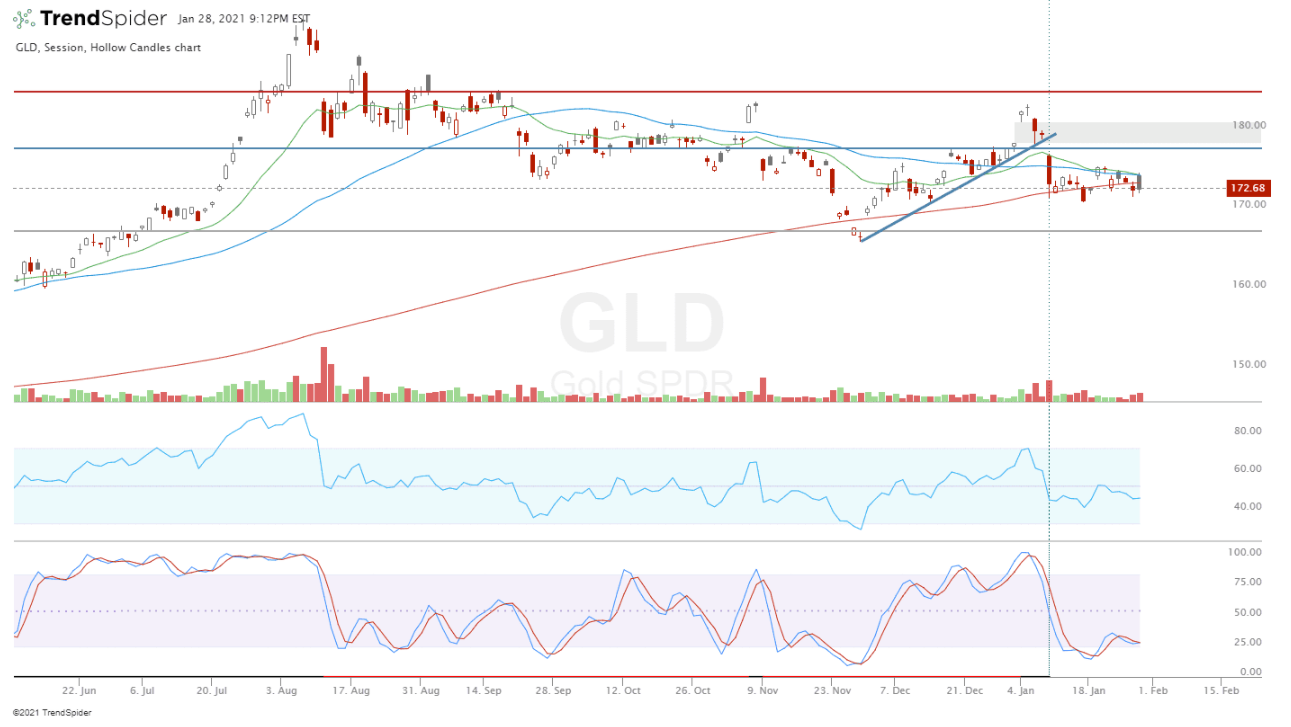
GLD Jan 28th, 2021
Bearish stocks will rally but understand the difference between a bounce and the longer term trend.
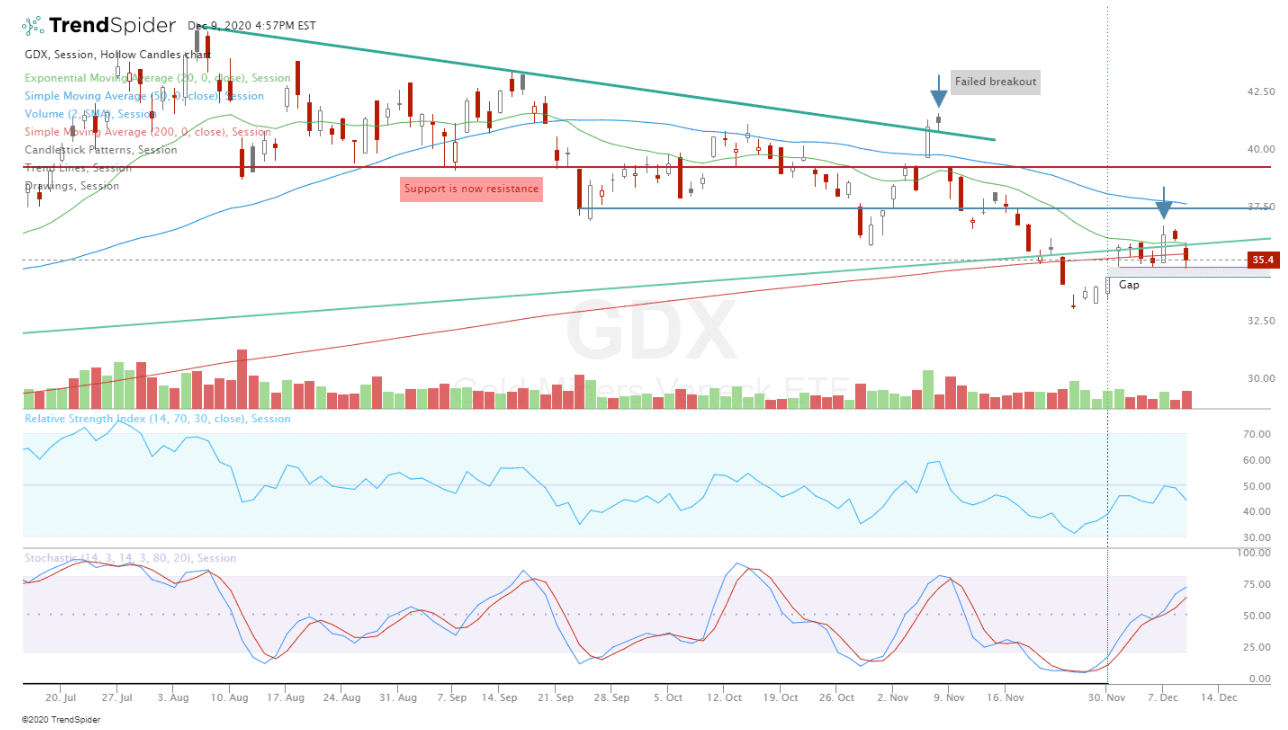
GDX Dec 9th, 2020
Every rally has been getting sold into. Best to just keep avoiding gold I think until there’s a strong signal, with consistent price action and not just when there’s a one day wonder. The last thing you want to do is chase this.