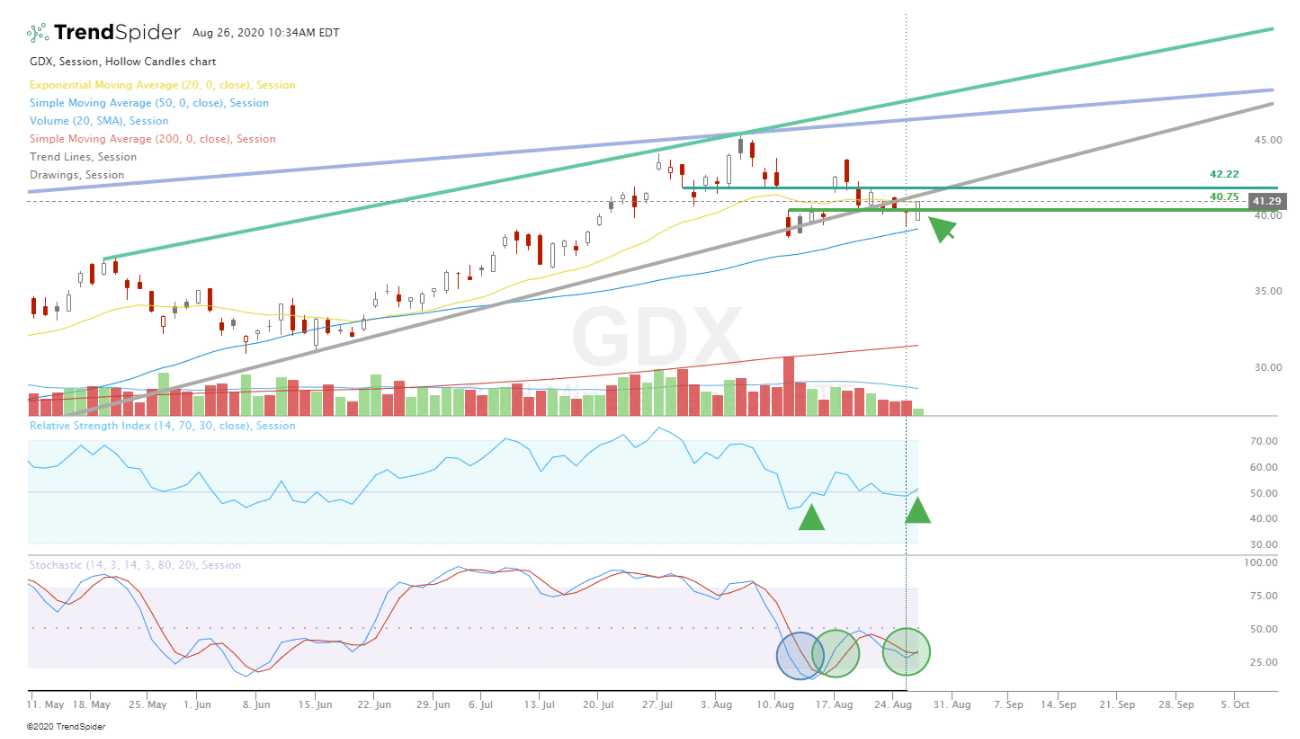
GDX August 26th, 2020
Looks like a good (reversal) signal above these initial points of resistance.
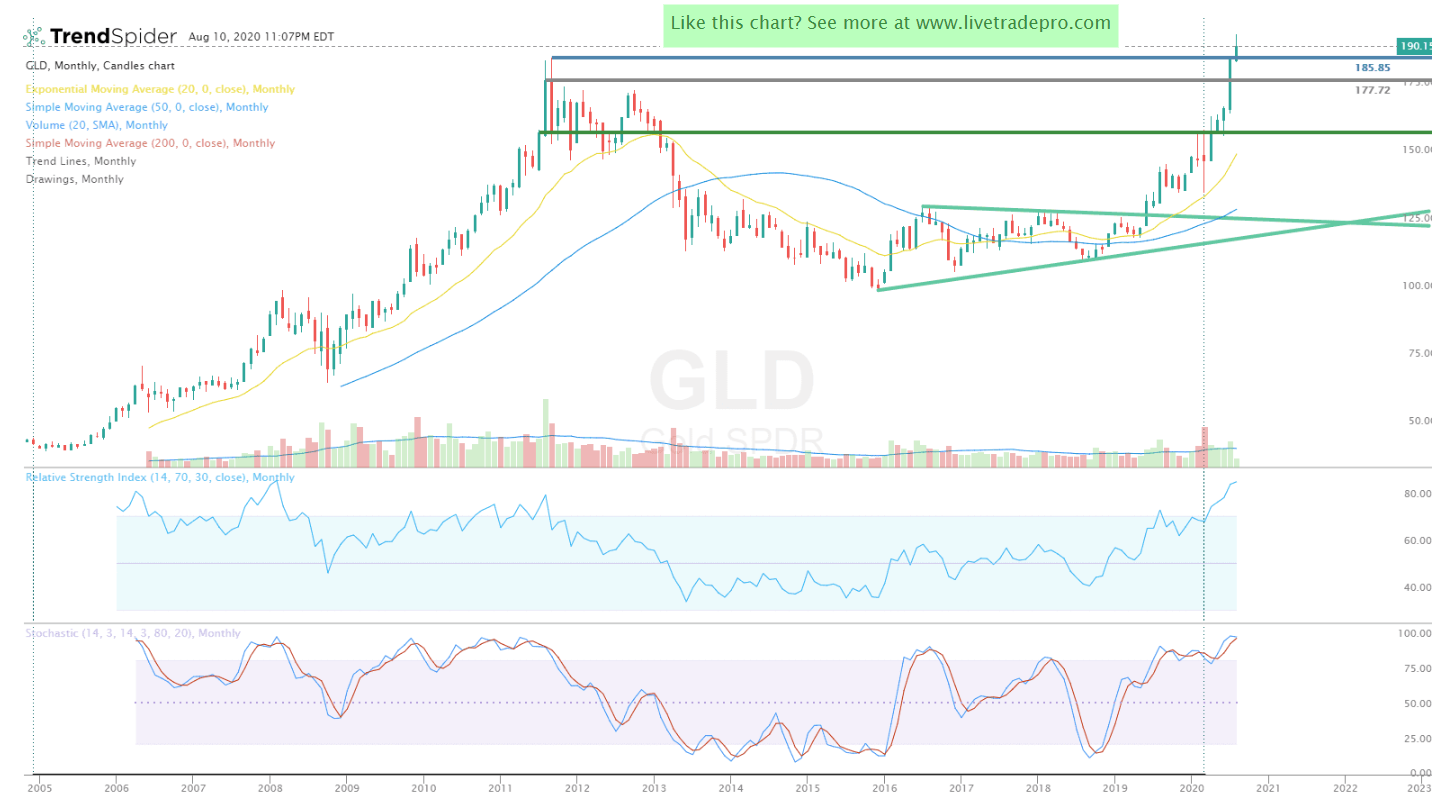
GLD August 10th, 2020 Monthly chart
Gold stocks have been very good to us but after 4+ months of nothing but green on gold, I dunno. Volatility could hit anytime. Putting my focus elsewhere at this time.
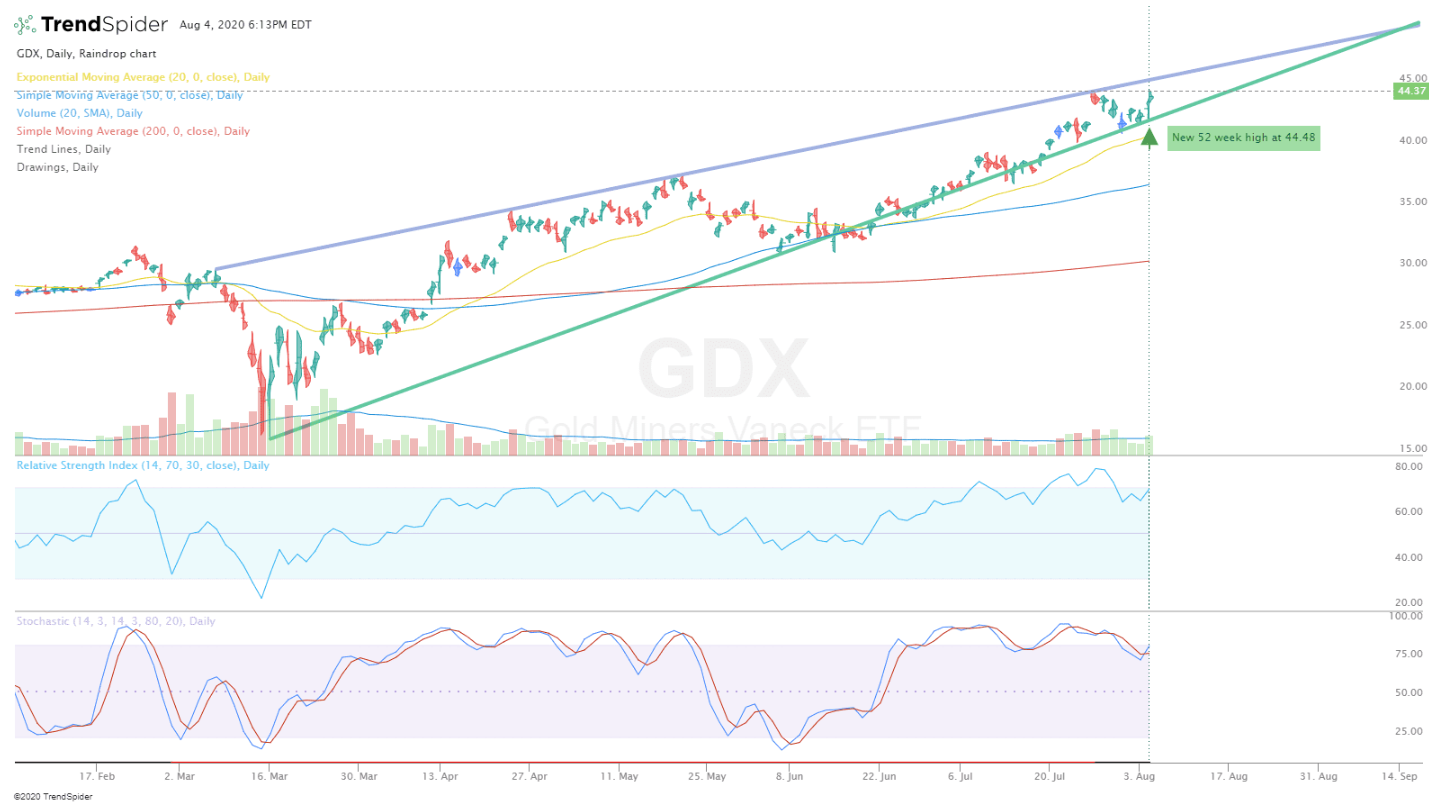
GDX August 4th, 2020
New 52 week high.
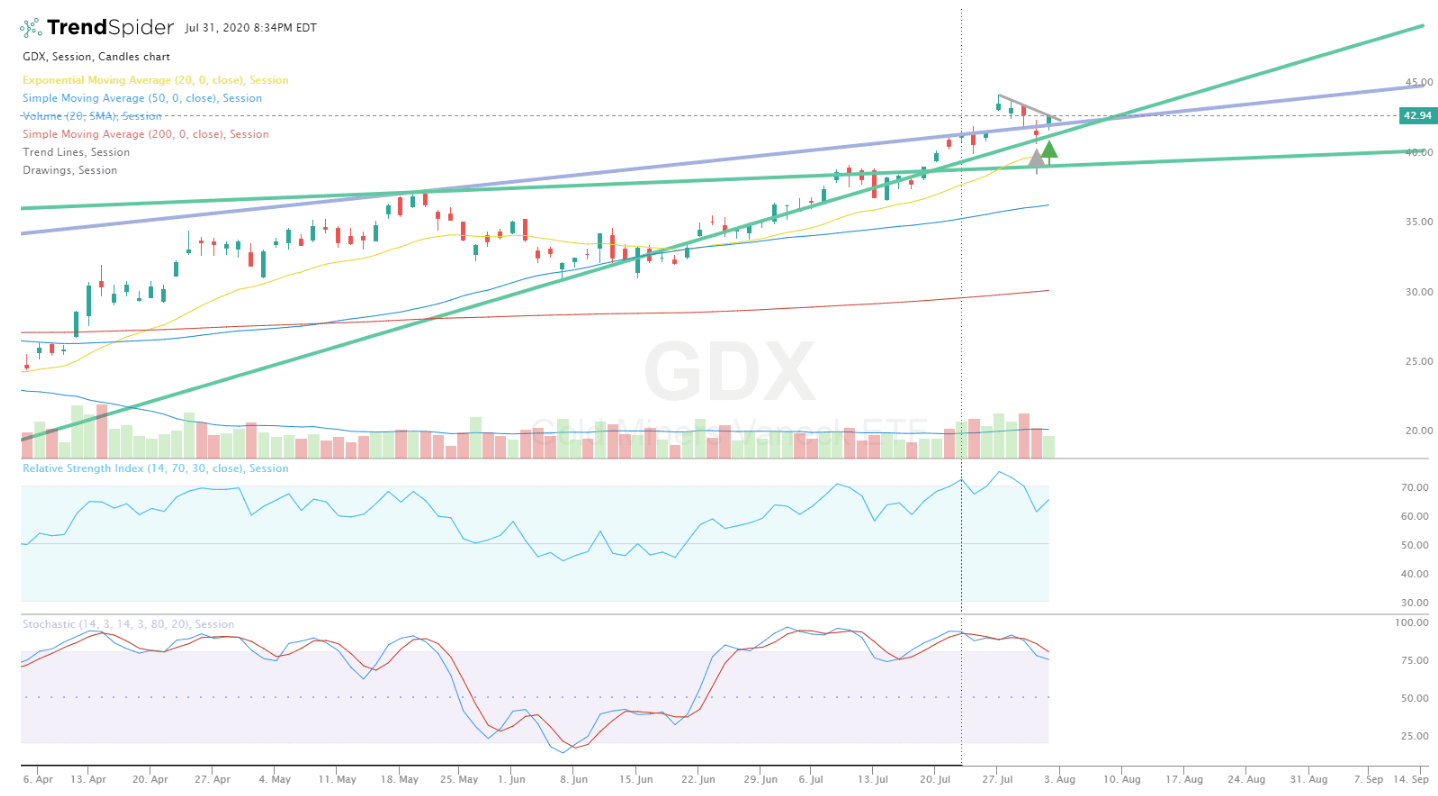
GDX July 31st, 2020
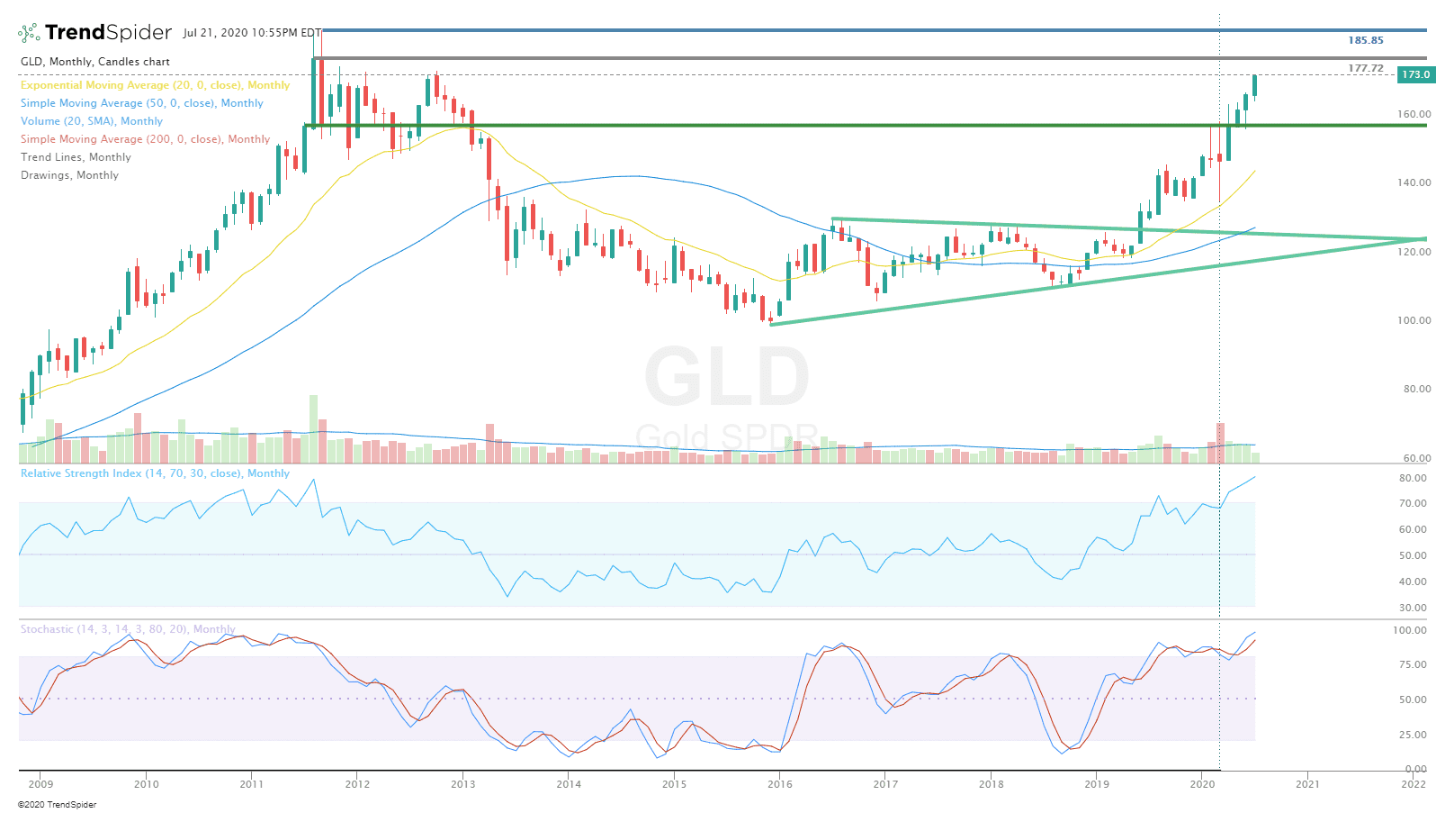
July 21st, 2020 Monthly chart
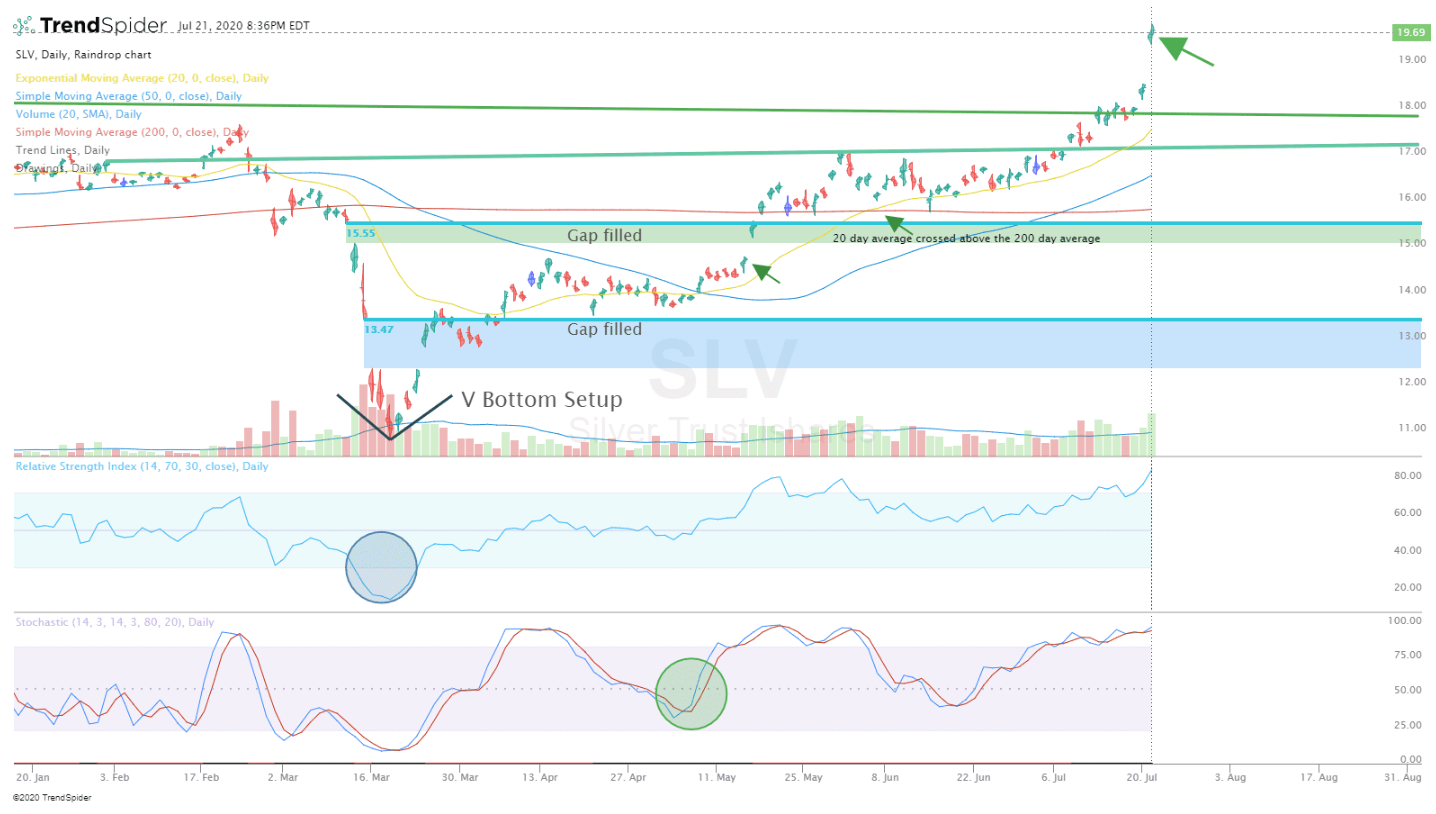
SLV July 21st, 2020
Never underestimate the POWER of a V Bottom
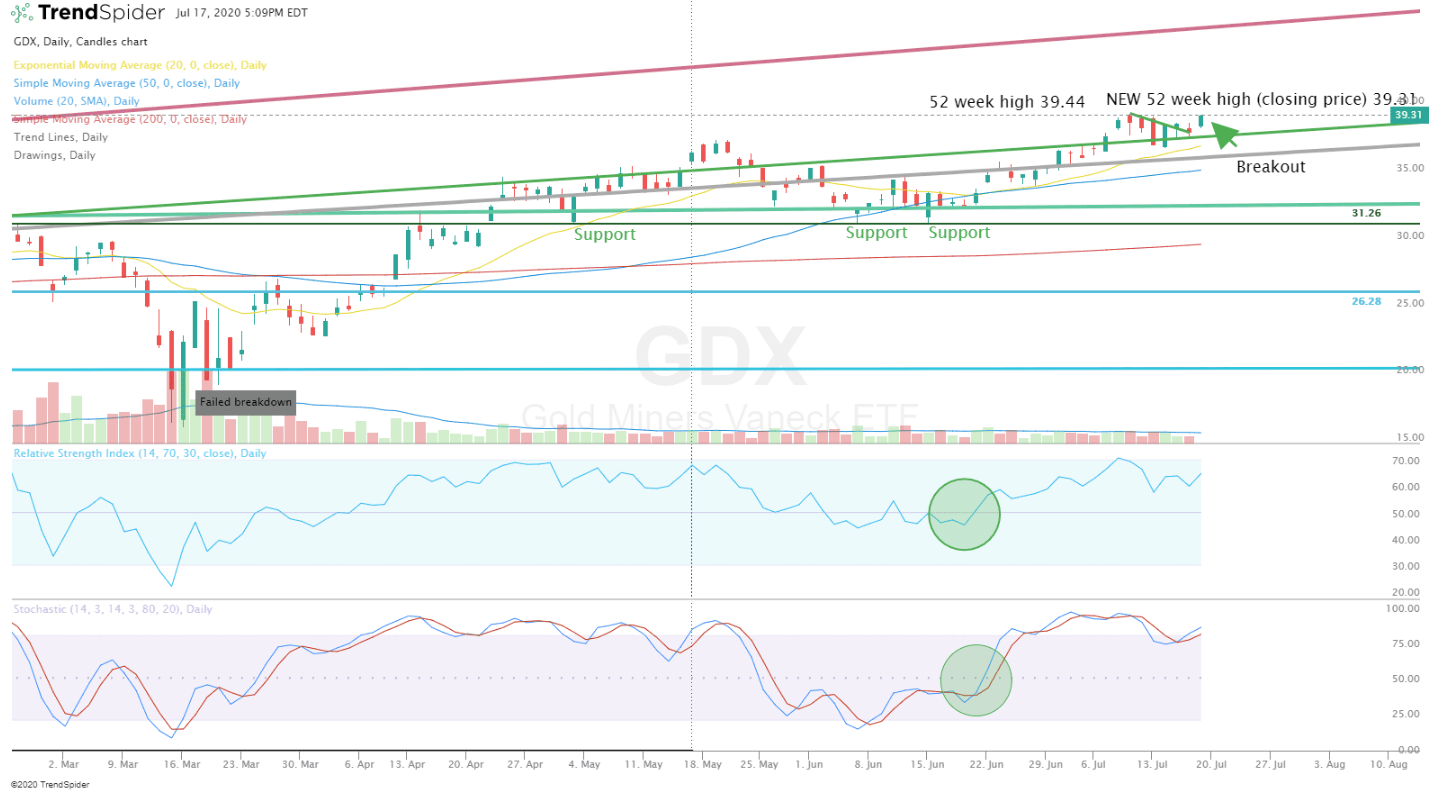
GDX July 17th, 2020
Another compelling move on gold mining stocks.
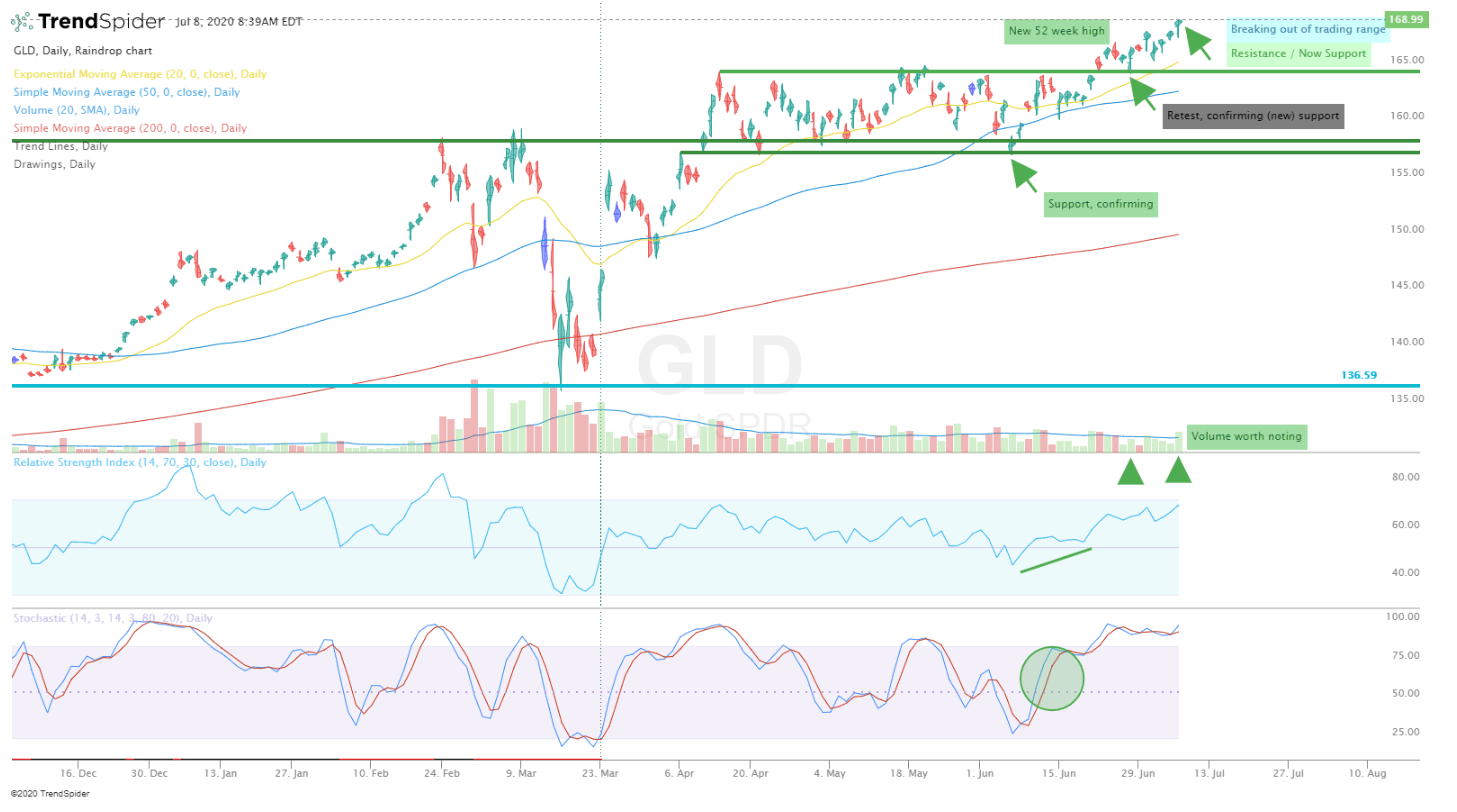
GLD July 7th, 2020
GDX July 7th, 2020

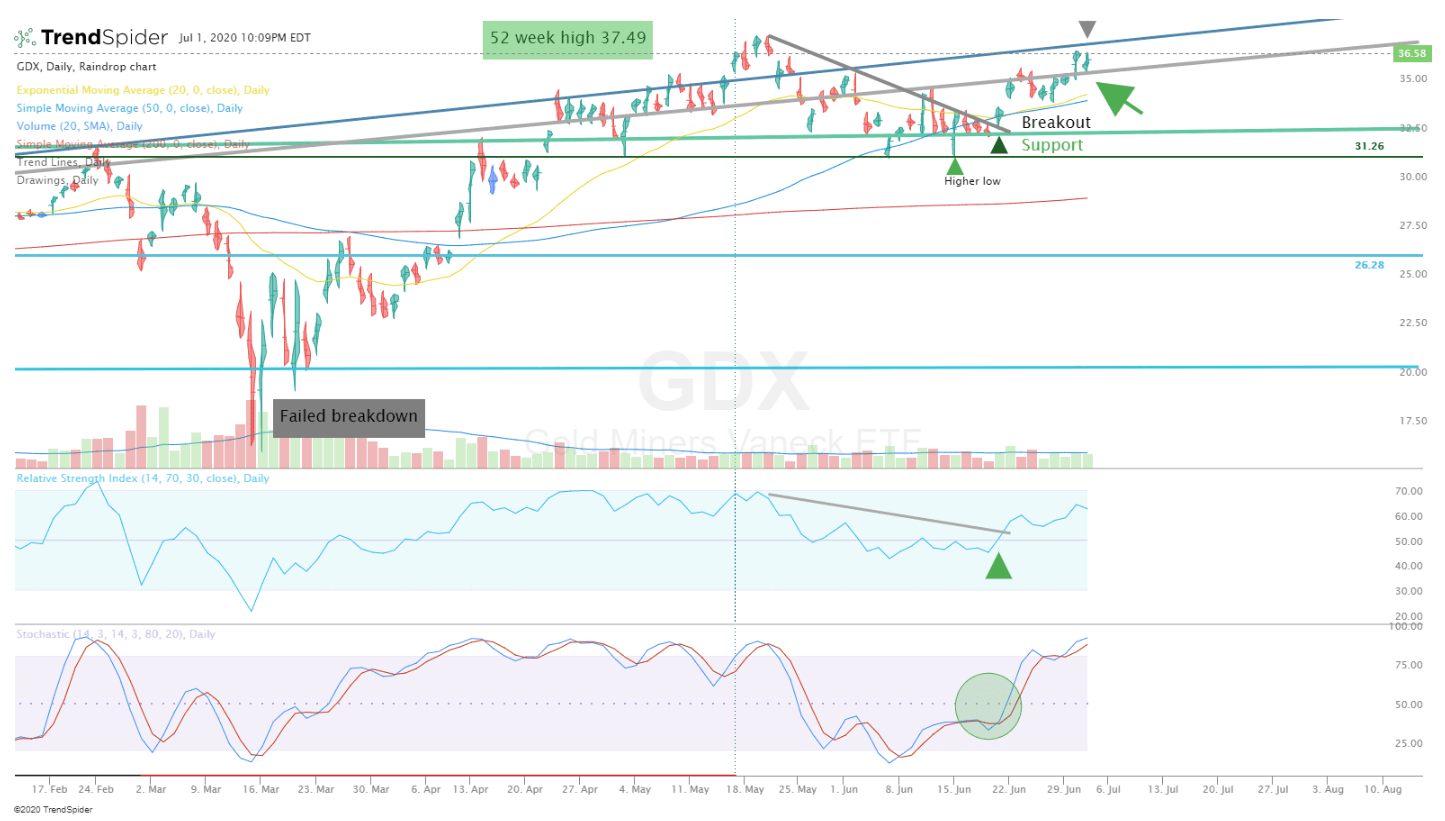
GDX July 1st, 2020
Closed slightly lower today but overall action still looks bullish, bouncing off this key level of support here.